The Case for Going Long the S&P500 Into the FOMC - Plus Key Market Updates
This article dives into the latest economic data, including the GDP print, the NFP report and the latest core PCE data. We also take a look at STIR pricing, FX positioning and more.
Hi everyone,
We're back with a longer update this week. Here's what we're covering:
Chart of the Week: Why going long the S&P 500 into the FOMC works
Macro Pulse: GDP data, the Fed, NFPs, and what’s ahead for Q3
Risk Assets Rundown: SOFR rally, EU exceptionalism, and seasonality
Trades: Positioning and thoughts on current trades
As always, if you find these write-ups helpful, I’d really appreciate it if you shared them, forwarded them to a friend, or posted them on X. It keeps me motivated to keep doing the work and putting these out regularly. Let’s jump in!
1. Chart of the Week: Long S&P500 into the FOMC
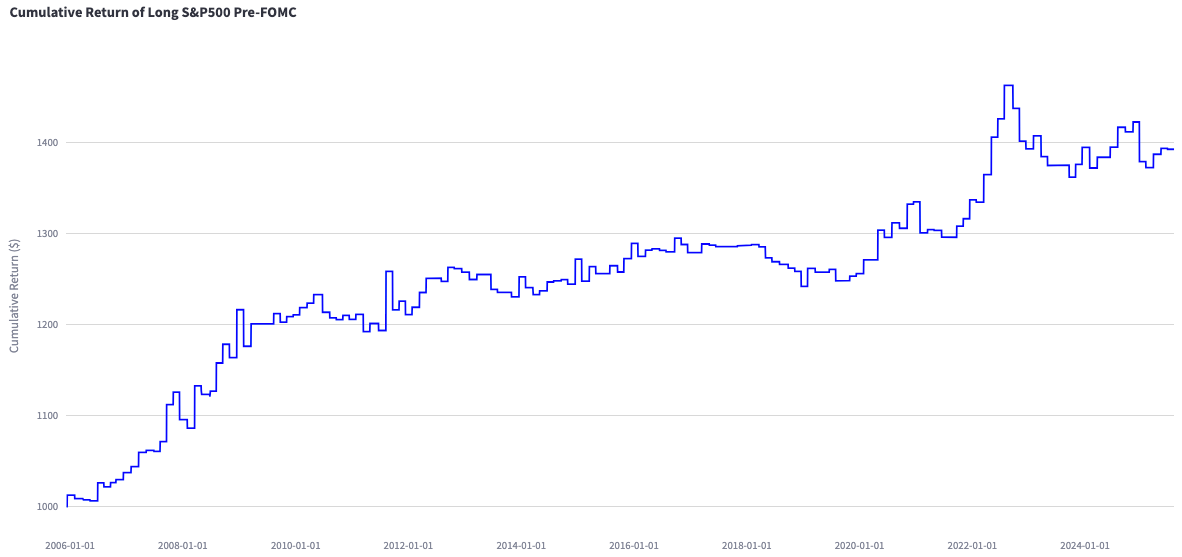
The chart below shows what happens if you consistently buy the S&P 500 at the close the day before an FOMC meeting and sell at the close the day after. The takeaway? It doesn’t pay to sell equities ahead of the Fed.
This simple strategy would have had you invested just 3.12% of the time, yet delivered a 1.73% annualised return. That’s roughly 17.3% of the S&P 500’s total historical return, while being exposed to the market for just a tiny fraction of the year.
2. Macro Pulse: GDP, NFPs and the FOMC
Last week brought a wave of economic data. Let’s recap where things stand - and what Q3 2025 might have in store.
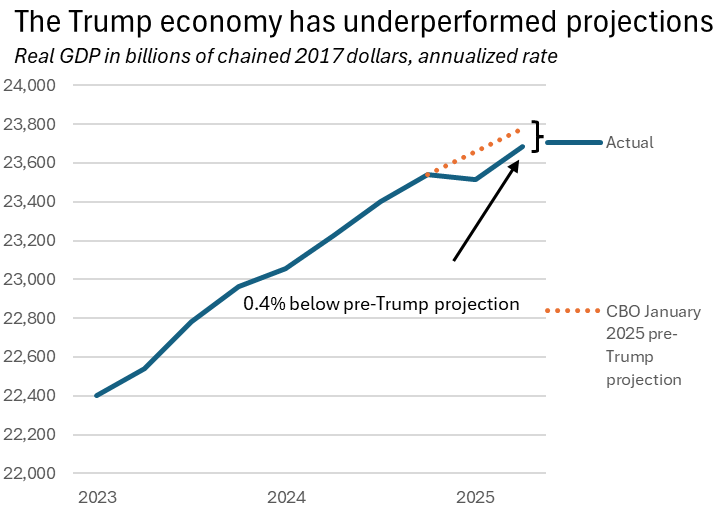
Q2 real GDP came in at 3.0%, stronger than expected on the surface. But that strength partly reflects a weak Q1, which flattered the quarter-on-quarter comparison. As the chart shows, the Trump economy is still running below trend.
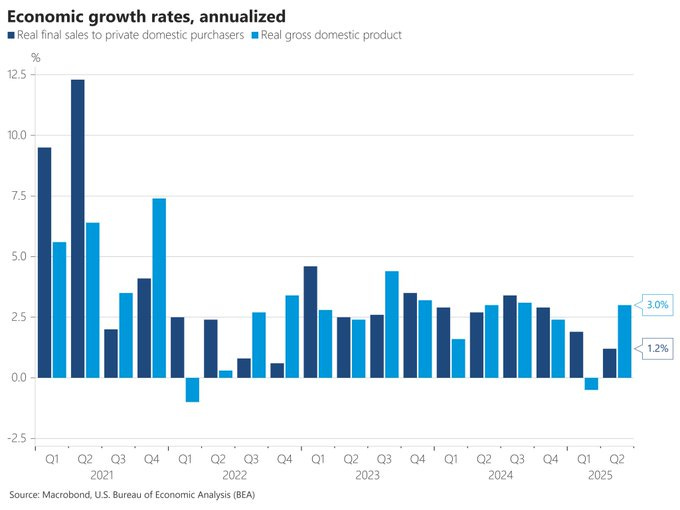
The headline number also masks a slowdown in the private sector. Real final sales to private domestic purchasers - a metric Powell closely watches - slowed to just 1.2%, down from over 2% in 2024. The chart below highlights the growing gap between overall GDP growth and weakening private sector demand.
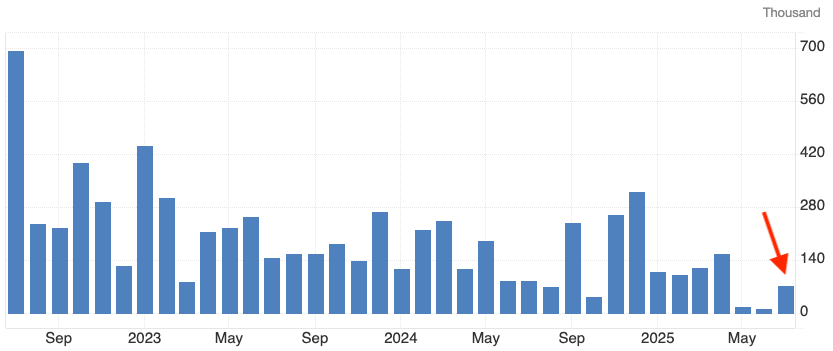
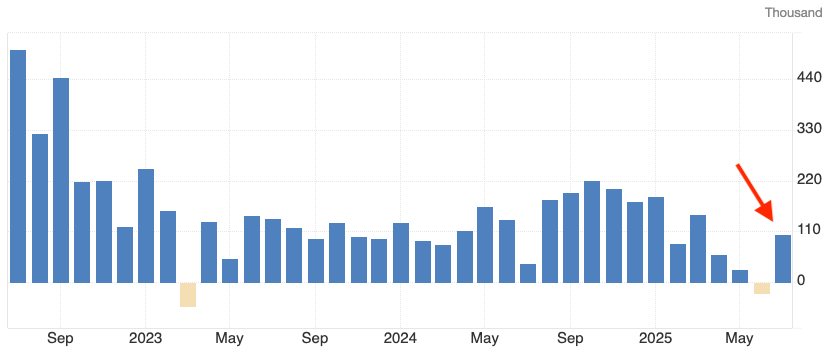
Many macro commentators on X have turned bearish on the U.S. economy - and this week’s NFP report added fuel to that narrative. The headline print came in at 73k vs. 106k expected, but the real story was the substantial downward revisions to May and June, totalling a net change of -258k.
In other words, the U.S. economy added only 19k jobs in May and 14k in June. July’s report also showed job losses in cyclical sectors like residential construction and manufacturing. If we strip out the non-cyclical education and healthcare sectors, the economy actually lost jobs in July.
The unemployment rate held at 4.2%, pointing to a supply-demand mismatch. Demand for labor is softening, but so is labor supply - due in part to tighter immigration policy. Overall, the labor market is clearly slowing. That said, there may be a glimmer of hope: while July’s numbers missed expectations, they were still an improvement over the prior two months.
The ADP employment data told a similar story. It came in at 104k vs. 77k expected, suggesting a modest re-acceleration in private sector hiring in July. Markets, of course, are forward-looking discounting mechanisms. So the key question is: has the weak data already been priced in?
There’s a growing disconnect between the economy and the stock market. The three largest companies now account for 20% of the S&P500, and the top ten for 37%. Even if the broader US economy slows, the Magnificent 7 can continue to benefit from the AI-driven capex boom. Slower hiring doesn’t necessarily imply equities need to fall.
Macro investors are turning bearish - mostly due to the labor market weakness. But there are several reasons why Q3-2025 might surprise to the upside:
Tariff clarity: Most of the major trade deals (EU, China, Japan) are now negotiated. That should remove uncertainty, support corporate investment, and help consumers adjust to the “new reality.”
Weaker USD = Easier financial conditions: The recent decline in the US dollar has boosted competitiveness for US exports. That tailwind may show up in Q3 data.
The wealth effect is alive and well. With equities at all-time highs and household net worth at $164 trillion (5.6x GDP), consumers feel rich - and that helps support spending.
Lower base for comparison: Q2 (private sector) numbers were soft. That makes it easier for Q3 to show a bounce simply due to base effects. If real final sales to private domestic purchasers come in at just 2%, it would still reflect a healthy economy.
Let’s talk about the FOMC. The Fed came in hawkish. Powell emphasized the dual mandate: price stability and maximum employment. He made it clear that the Fed’s job is not to lower government interest costs or boost GDP growth.
The Fed funds target range was left unchanged at 4.25–4.5%, and the Fed views policy as "moderately restrictive." But with NFPs coming in so weak, that stance may be hard to maintain. The labor market is slowing, and a "less restrictive" position may soon be warranted.
Notably, Waller and Bowman dissented - the first time two governors have dissented since 1993. They’re now likely in the running for the next Fed Chair, and the latest jobs data may bolster their position.
And lastly, let’s take a look at inflation. According to Piper Sandler, the costs of tariffs break down as follows:
60% absorbed by US companies
20–30% passed to US consumers
10–15% borne by foreign exporters
The table below summarises these estimates.
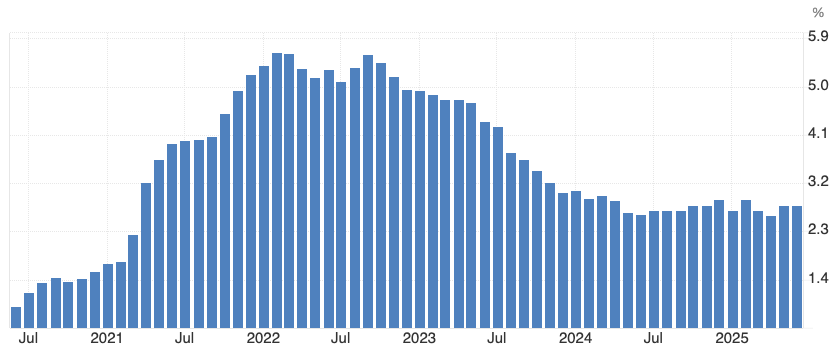
At some point, firms may stop eating the costs. This week’s data showed that core PCE inflation accelerated to 2.8% (vs. 2.7% expected). That means the Fed has made no progress on inflation since the start of 2024. If companies begin to pass through more of the tariff burden to consumers, the inflation picture could worsen - and the path to rate cuts becomes even more complicated.
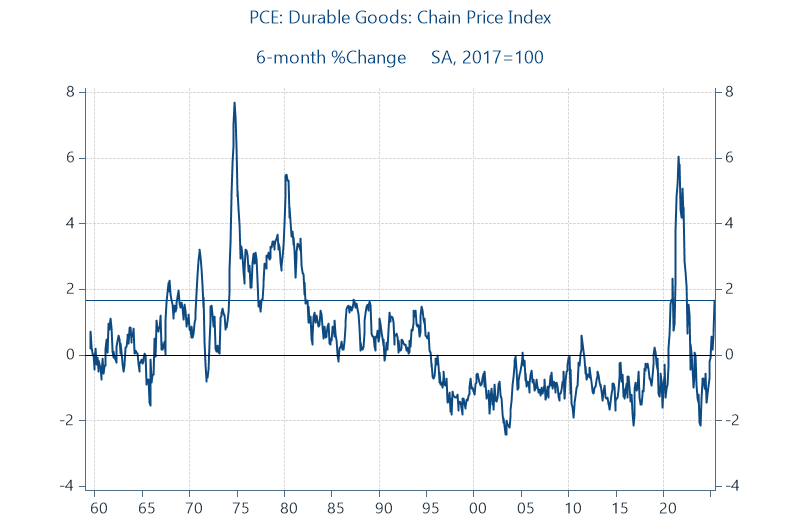
And tariffs are starting to show up in the inflation data - durable goods prices are rising again as the below chart shows.
We’ve got a lot of economic data this week. Let’s summarise:
The US economy is still growing at ~2%, but it is slowing. The “Trump economy” is running below trend.
The US labor market is near maximum employment, but it is slowing (fast). The demand for labor and the supply of labor have fallen.
The Fed’s tone was more hawkish than expected, yet the recent NFP report suggests a rate cut may come as soon as September.
Core PCE inflation is holding steady at 2.8%, and tariffs are starting to make their presence felt in the inflation data.
3. Risk Assets Rundown: SOFR Rally, EU Exceptionalism, and Weak Equity Seasonality
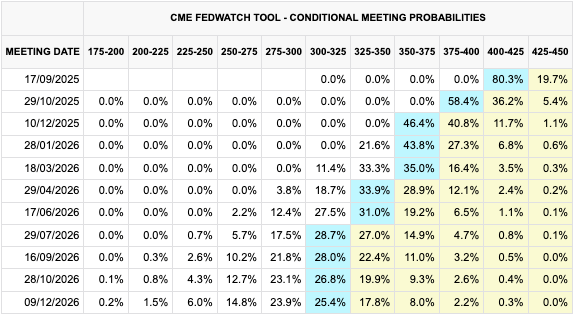
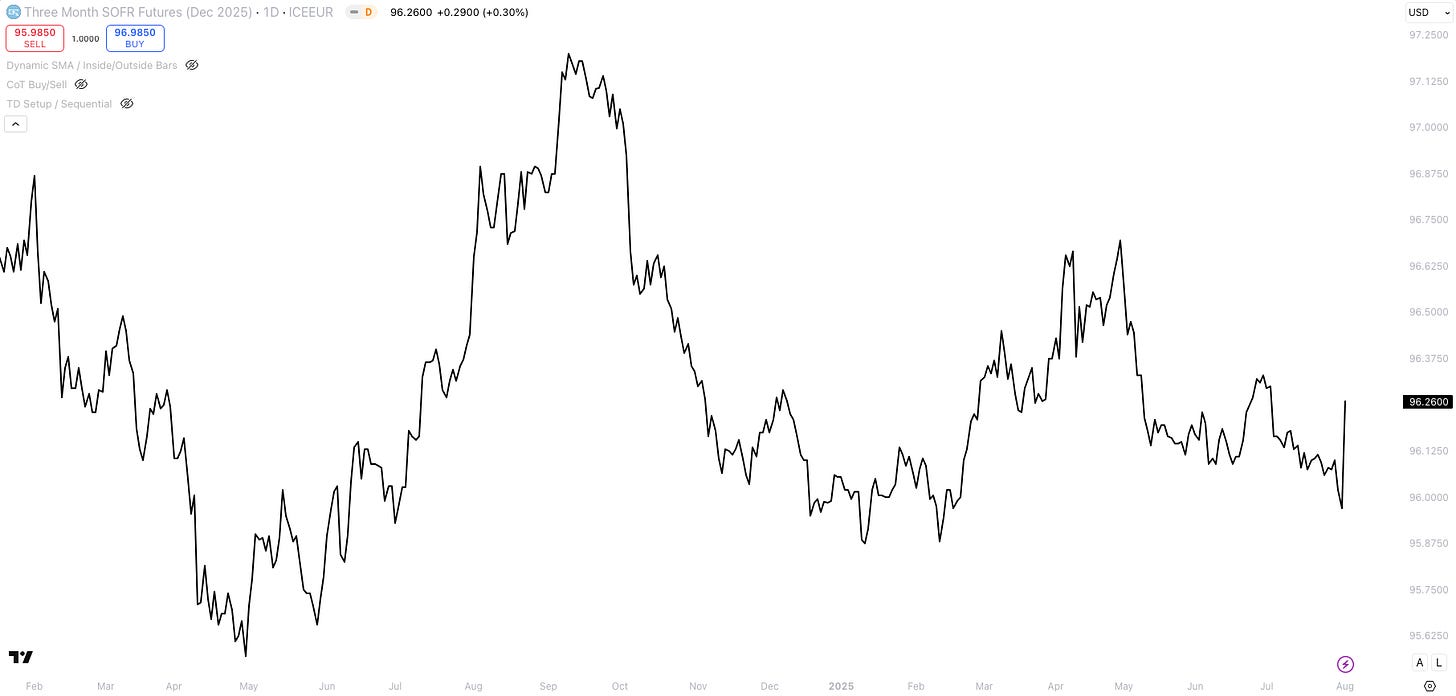
STIR markets have repriced sharply following the NFP report. The base case now includes three rate cuts in 2025, with markets pricing roughly an 80% chance of a September cut, a 58% chance of another in October, and a 46% probability of a third in December.
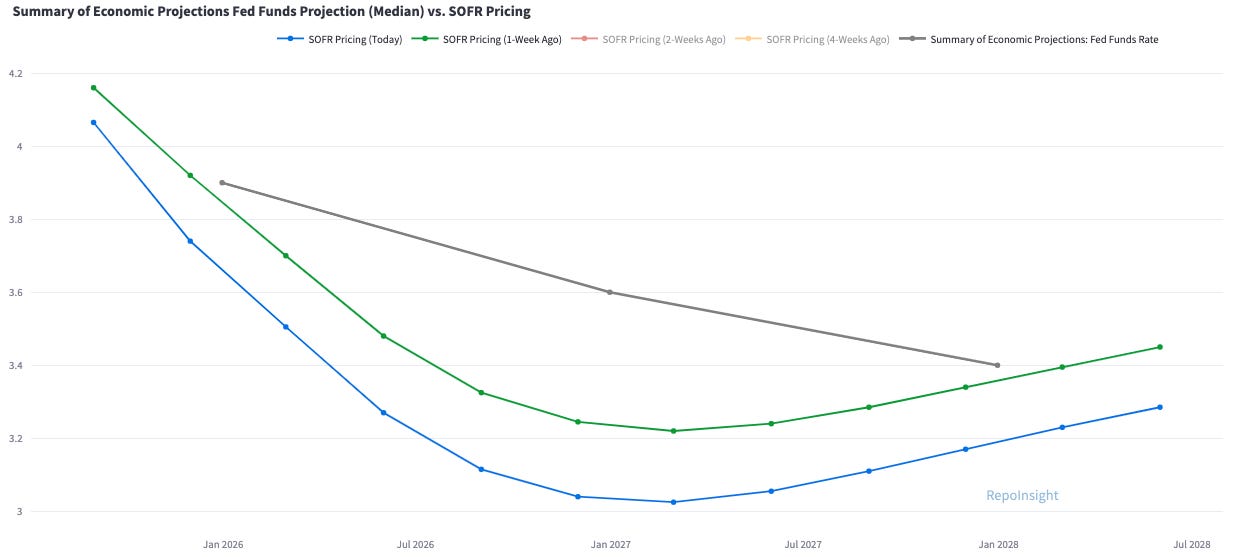
SOFR futures now price in six rate cuts through December 2026, implying a terminal rate around 3.05%. The market narrative has shifted from a “hawkish Fed” stance to one focused on “weak economic data” justifying insurance cuts.
I don’t have a strong conviction on current pricing. Two rate cuts in 2025 seem realistic, while three cuts might be ambitious if core PCE accelerates and unemployment stays around 4.2%. If Q3 economic data surprises on the upside, fading the recent rally in SOFR December 2025 futures could be a good trade. For now, though, I remain cautious.
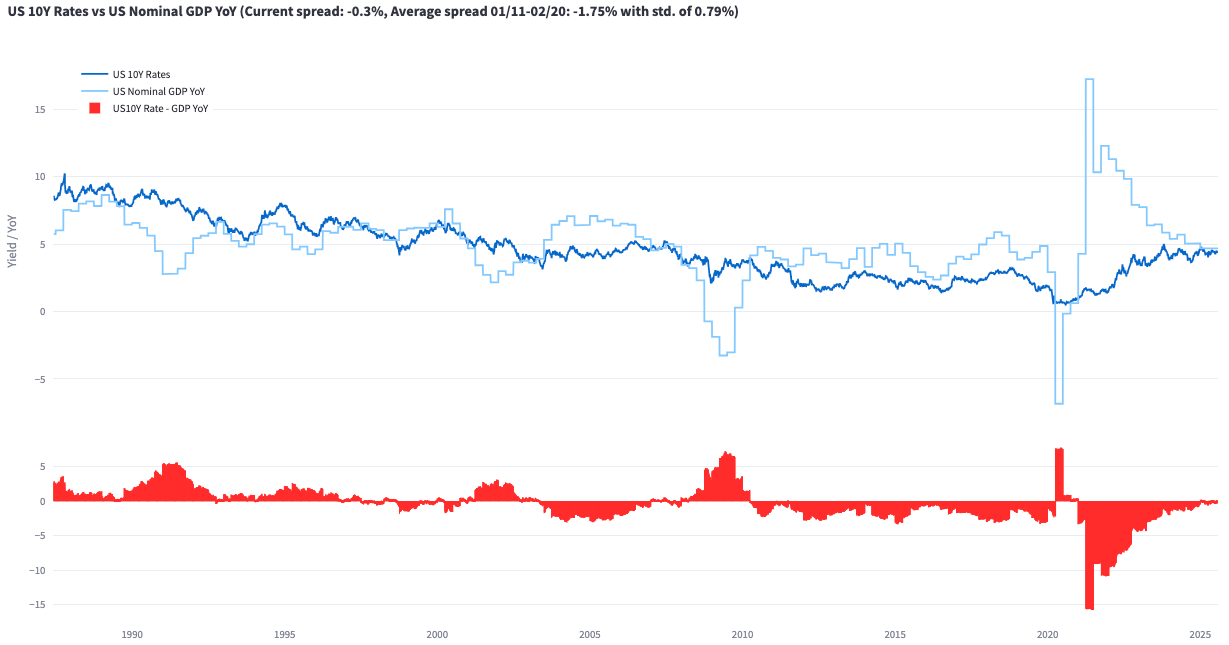
The US 10-year yield dropped sharply on Friday to 4.22%. A useful mental model is that the 10-year yield should roughly track nominal GDP growth. With real GDP around 2% and inflation near 2.5%, the current yield appears close to fair value.
More Fed cuts usually mean a weaker US dollar, right? I’m not so sure. The “Sell USD” narrative that gained traction recently rested on several key points - many of which no longer hold.
The idea that AI capex had peaked was disproven by strong earnings from Microsoft and Meta. Meta alone expects capex of $66-72 billion this year.
Section 899, which would have introduced new taxes on foreign investors in Treasuries, was dropped from the “One Big, Beautiful Bill.”
The reported fiscal record at Mar-a-Lago turned out to be incorrect.
The Bank of Japan has shifted back to a more dovish stance, undermining the “long yen” leg of the trade.
“European exceptionalism” has likely peaked - the DAX is where it was three months ago.
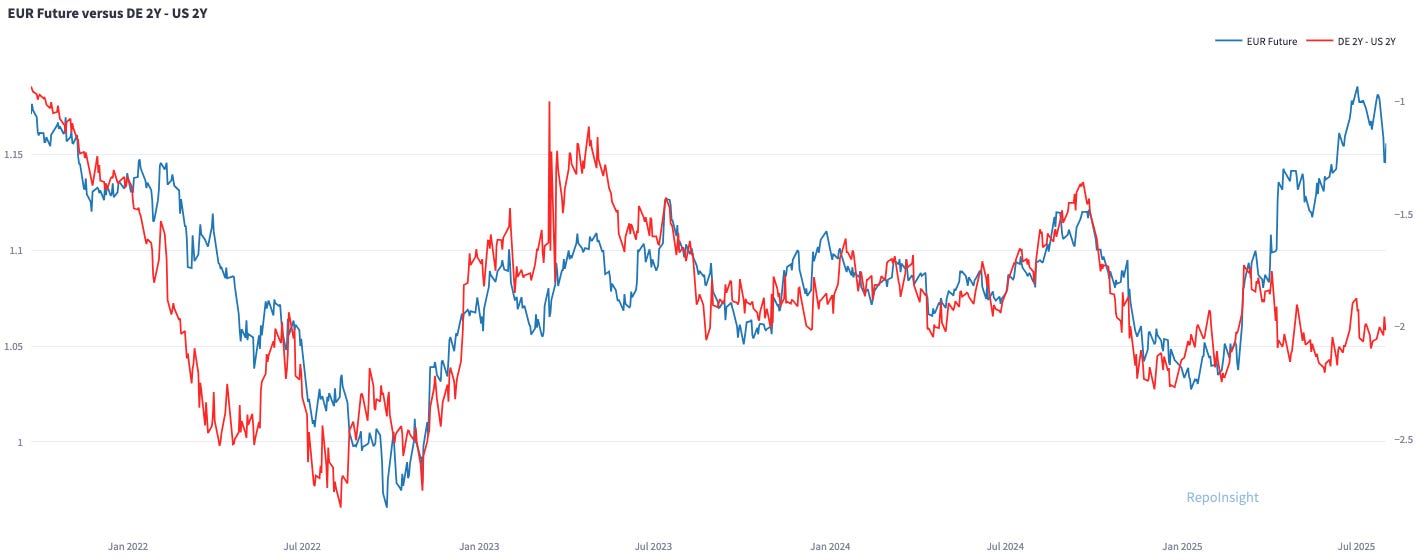
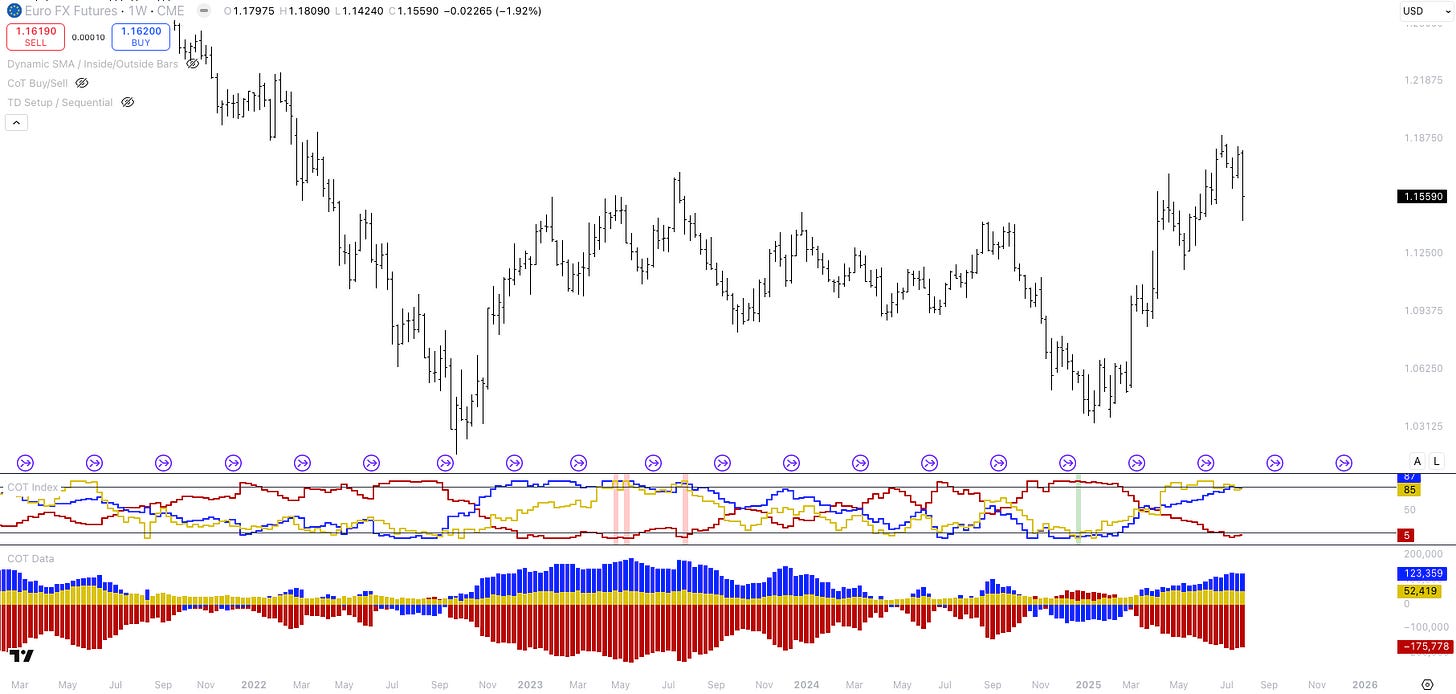
The Euro had a strong day on Friday after the NFPs, but I believe its peak was earlier in the week. The gap between the Euro and the DE2Y-US2Y yield differentials (see chart below) looks set to narrow in the coming weeks.
CoT positioning shows that both large speculators (blue) and small speculators (yellow) have built significant long positions in the Euro. While positioning isn’t a timing tool and I could still be wrong, the risk-reward looks more favourable for shorting the Euro than “jumping on the trend (late)”.
I have less conviction on other currencies because their positioning isn’t as one-sided as it is with the Euro. For instance, the Swiss Franc appears overvalued based on yield differentials, but positioning isn’t as stretched. The British Pound, Canadian dollar, Australian dollar, and New Zealand dollar don’t look overvalued based on yield differentials either.
Turning to equities, the Mag-7 companies continue to post impressive earnings. Microsoft, the world’s second-largest company, grew revenues by 18% last quarter. Its cloud computing segment, Azure, generated $75 billion over the past twelve months.
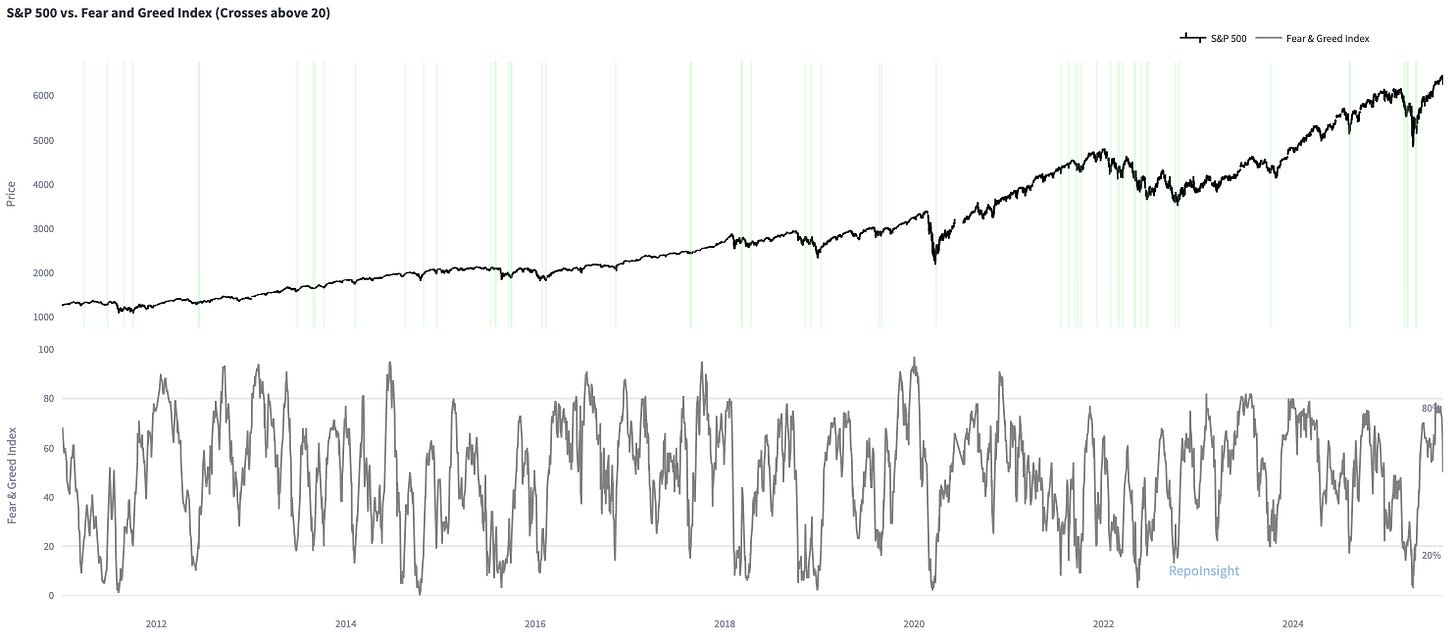
Given that the largest 10 companies, mostly tech-focused except for Berkshire Hathaway, make up nearly 40% of the S&P 500, it’s tough to make a fundamental case for shorting the index. Friday’s sell-off felt healthy, as many indicators - like the Fear & Greed index - were signalling overbought conditions.
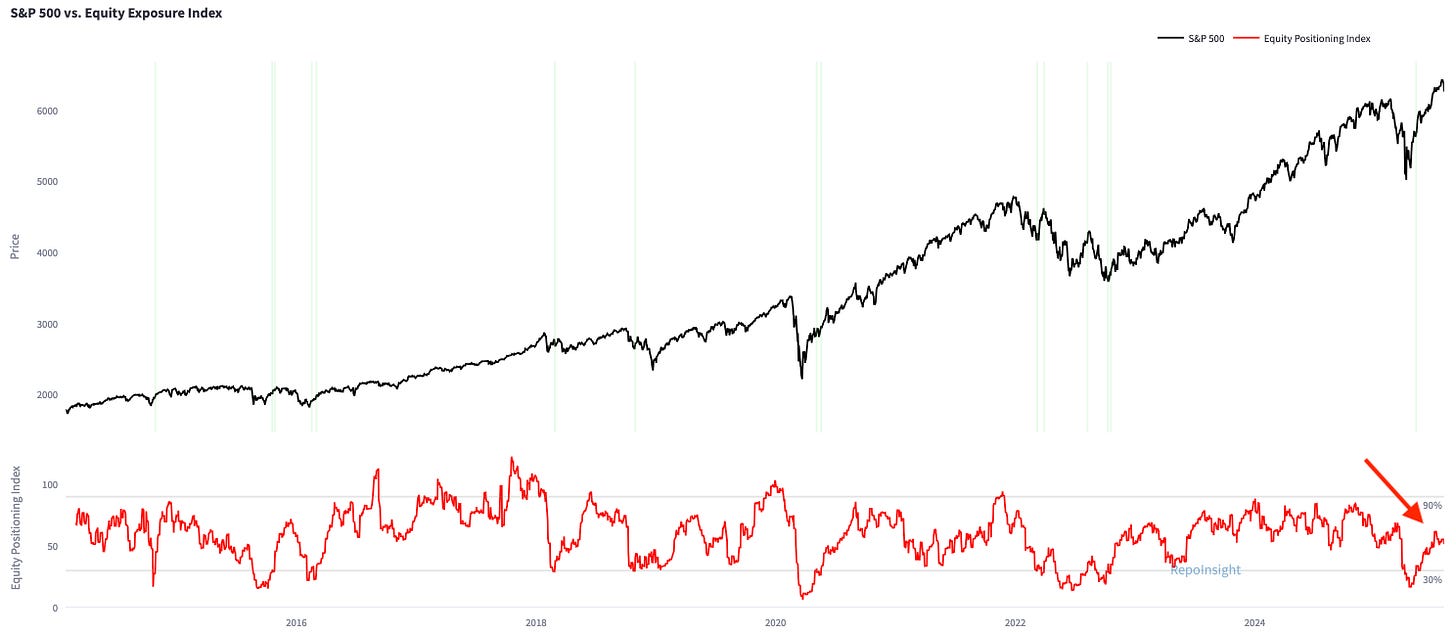
Positioning across a broad range of measures - futures positioning, volatility-targeting equity allocations, and the NAAIM survey - remains neutral.
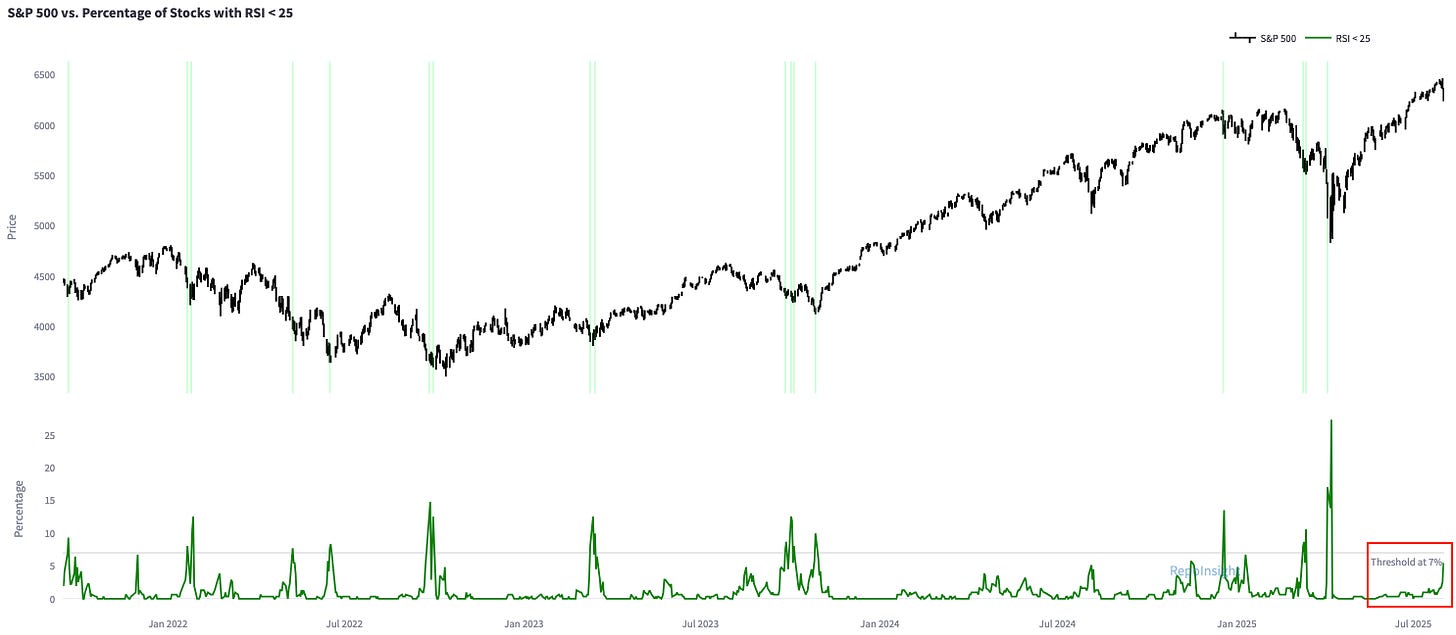
If Friday’s sell-off extends into next week, the rising number of S&P 500 stocks with RSIs below 25 could signal a buying opportunity.
In terms of seasonality, the outlook for equities isn’t very encouraging. Between 1988 and 2023, the S&P 500 has declined on average by 0.51% in August and 0.78% in September. This combination of weak seasonality and softer macro conditions suggests we may see choppy, sideways action in the weeks ahead. However, if equities sell off further - say another ~5% - it could present a solid buying opportunity.
4. Trades
This week was an emotional roller coaster. On Monday, I put on two positions:
I bought Russell 2000 futures. Given that speculators are heavily short the Russell 2000, I expected a potential short squeeze. That bet didn’t pay off - I lost about 0.75% on the trade.
I converted EUR to USD and caught roughly half of the Euro’s sharp decline on Monday. The EU trade deal announced last Sunday gave the EU a tariff rate of 15% instead of 30%, but the Euro still sold off sharply. Recently, EU assets traded as if “European exceptionalism” was alive and well, but the deal underlines the economic reality: the EU is falling behind. Monday’s price action felt like a major shift in sentiment. I’m still long USD in my EUR-denominated trading account.
Putting on these trades wasn’t easy, and while I initially made some gains - the trading account rose from 6.6% to 8.0% YTD - Friday’s reversal hit hard. I was stopped out of the Russell 2000, and the Euro rallied, bringing me back down to 6.2%. I’ll continue holding my long USD position but don’t have conviction for new trades at the moment.
I hope you enjoyed this article. This is not investment advise and all views are my own. I write these articles because they help me to stay disciplined and transform my thoughts into actionable trade ideas. I always appreciate your feedback, likes and comments!



If Q3 economic data continues to disappoint but isn’t horrible and you had to short SR3Z2025 at what level would you start shorting? Also thank you for the post!