
How you can track balance sheet capacity and funding stress: First cracks in the financial system?
Liquidity drives markets. In this article, I explain how liquidity works, why the outlook on liquidity is mostly positive and how you can track funding stress, liquidity and balance sheet capacity.

Financial news can be overwhelming. If you get sucked into too many different narratives, you might miss the tree in the forrest. That is why I like to focus on the most important drivers of financial markets. One of the most important drivers is liquidity.
Stanley Druckenmiller, a true hedge fund legend who returned more than 30% p.a. over the course of 30 years, pointed this out in 2015:
"Earnings don't move the overall market; it's the Fed, focus on the central banks, and focus on the movement of liquidity, most people in the market are looking for earnings and conventional measures. It's liquidity that moves markets."
In this analysis, I would like to summarize some of the most important liquidity drivers. And despite the Federal Reserve doing QT at a pace of 95bn USD a month, which is effectively sucking liquidity out of the financial system, it does not look too bad. Let’s dive in!
1. The drain of the reverse repo facility
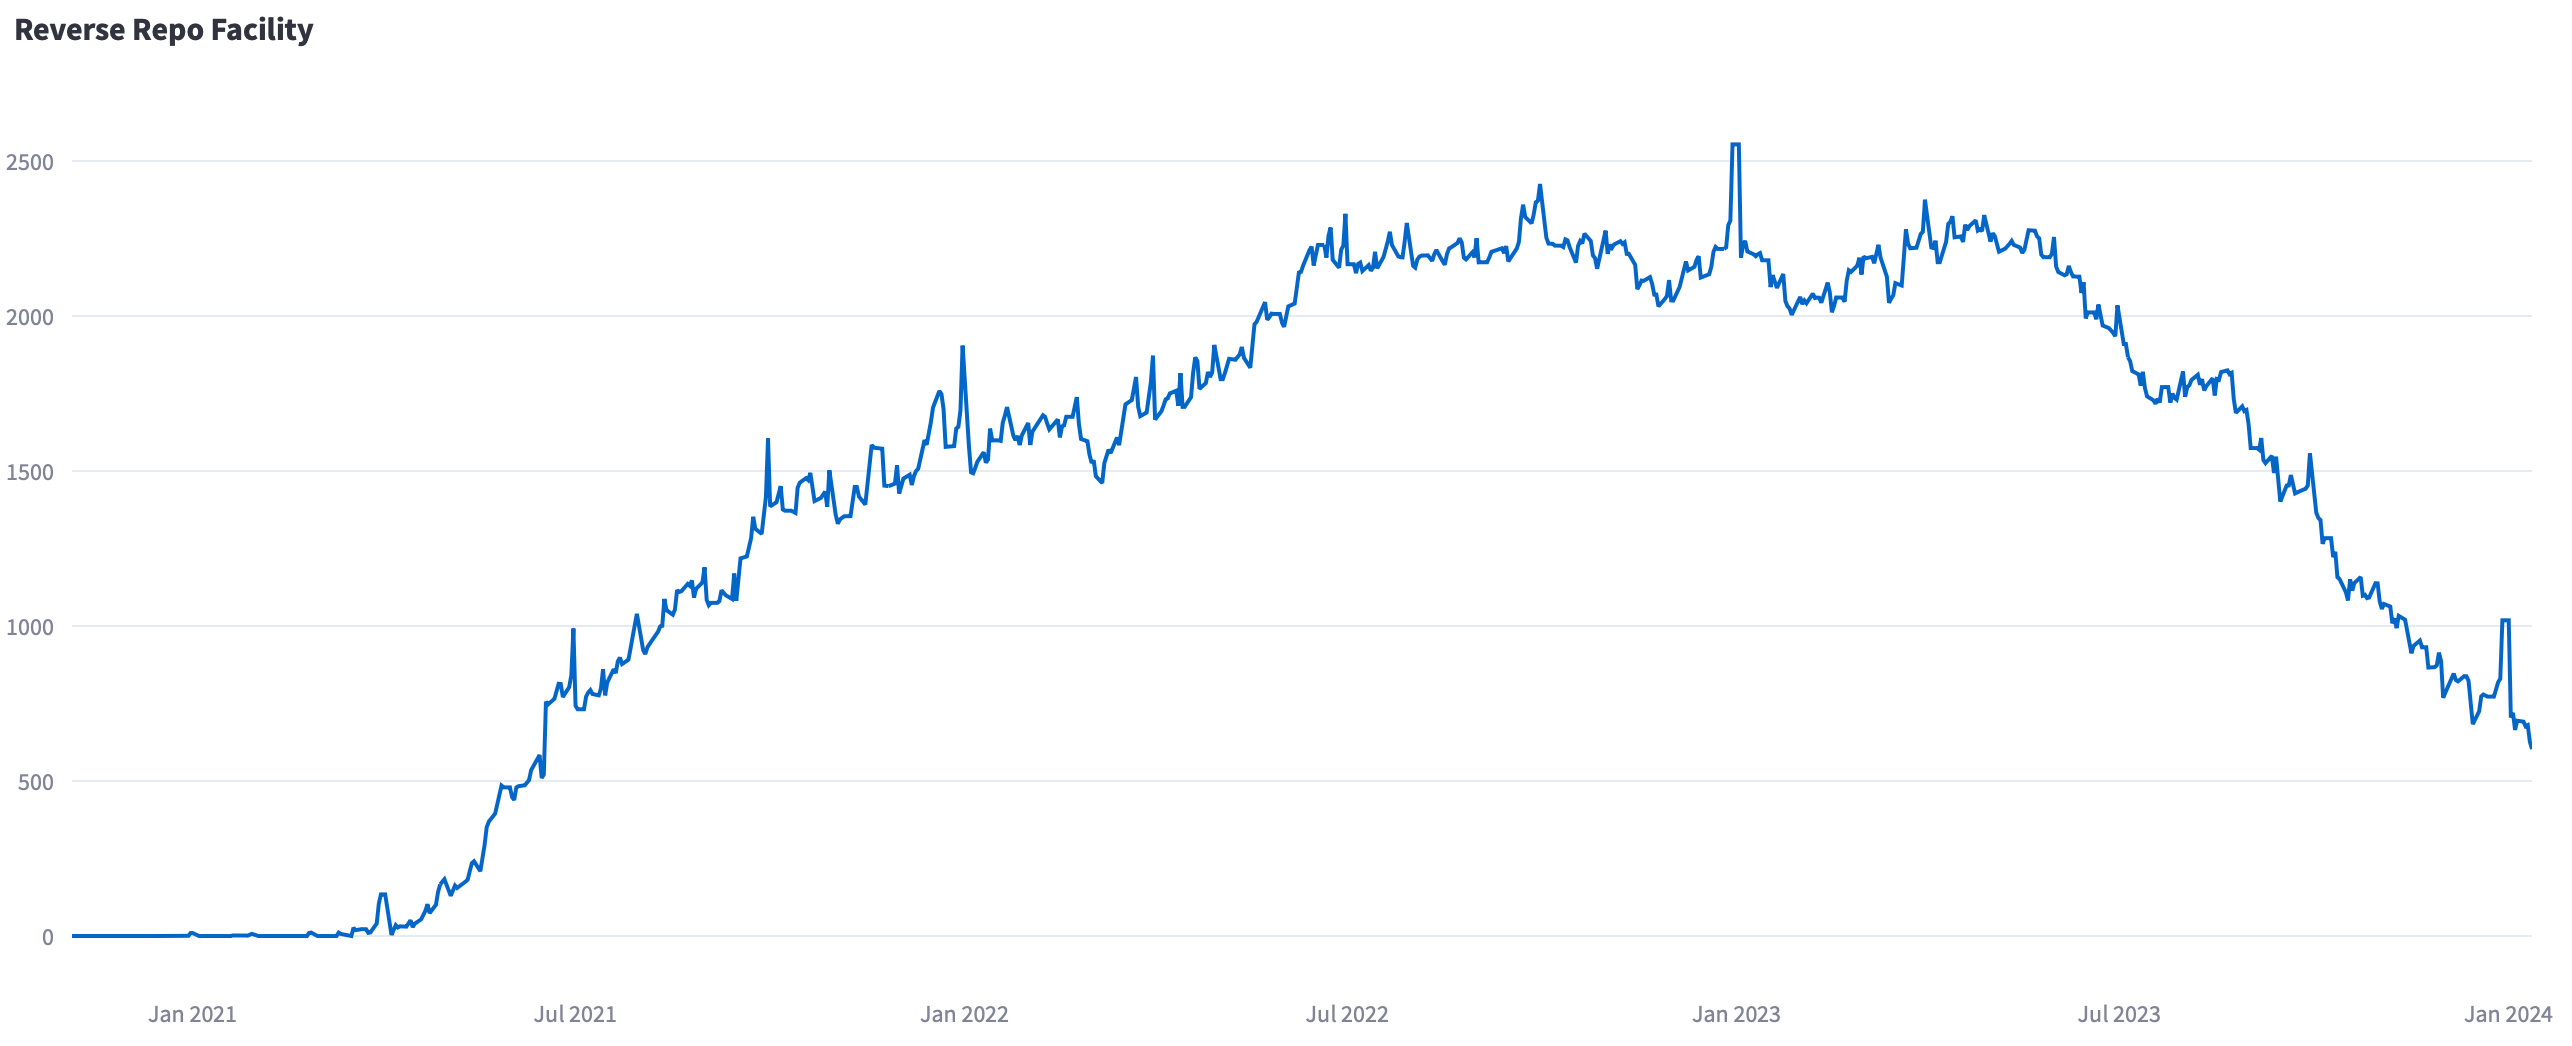
The reverse repo facility (RRP) allows banks, financial institutions and (mostly) money market funds to park cash at the Federal Reserve overnight. This is done in a reverse repo transaction: the MMF gives cash to the Fed and the Fed collateralizes the “deposit” with Treasuries from its portfolio.
When financial institutions park cash at the Fed, liquidity, which would normally circulate in the financial system, is sucked out of the financial system. This happened right after the covid pandemic when financial markets were flooded with liquidity and MMFs did not have higher yielding alternatives. They parked the cash at the Fed in the RRP. However, in the past months, this trend has reversed and liquidity parked at the Fed is now falling rapidly, i.e., flowing back into the financial system. At this point, there are “only” 600bn USD in the RRP - down from 2.5tn USD in beginning of 2023.
2. The 3-month T-Bill Rate vs. the ON RRP
What drives this trend? It is mostly driven by the fact that MMFs can earn a pickup from shifting their cash into 3-month T-Bills versus parking their cash in the RRP. In the chart below, you can see the spread of the 3-month T-Bill rate vs the ON RRP rate. MMFs can earn a 7-8 bps pickup.
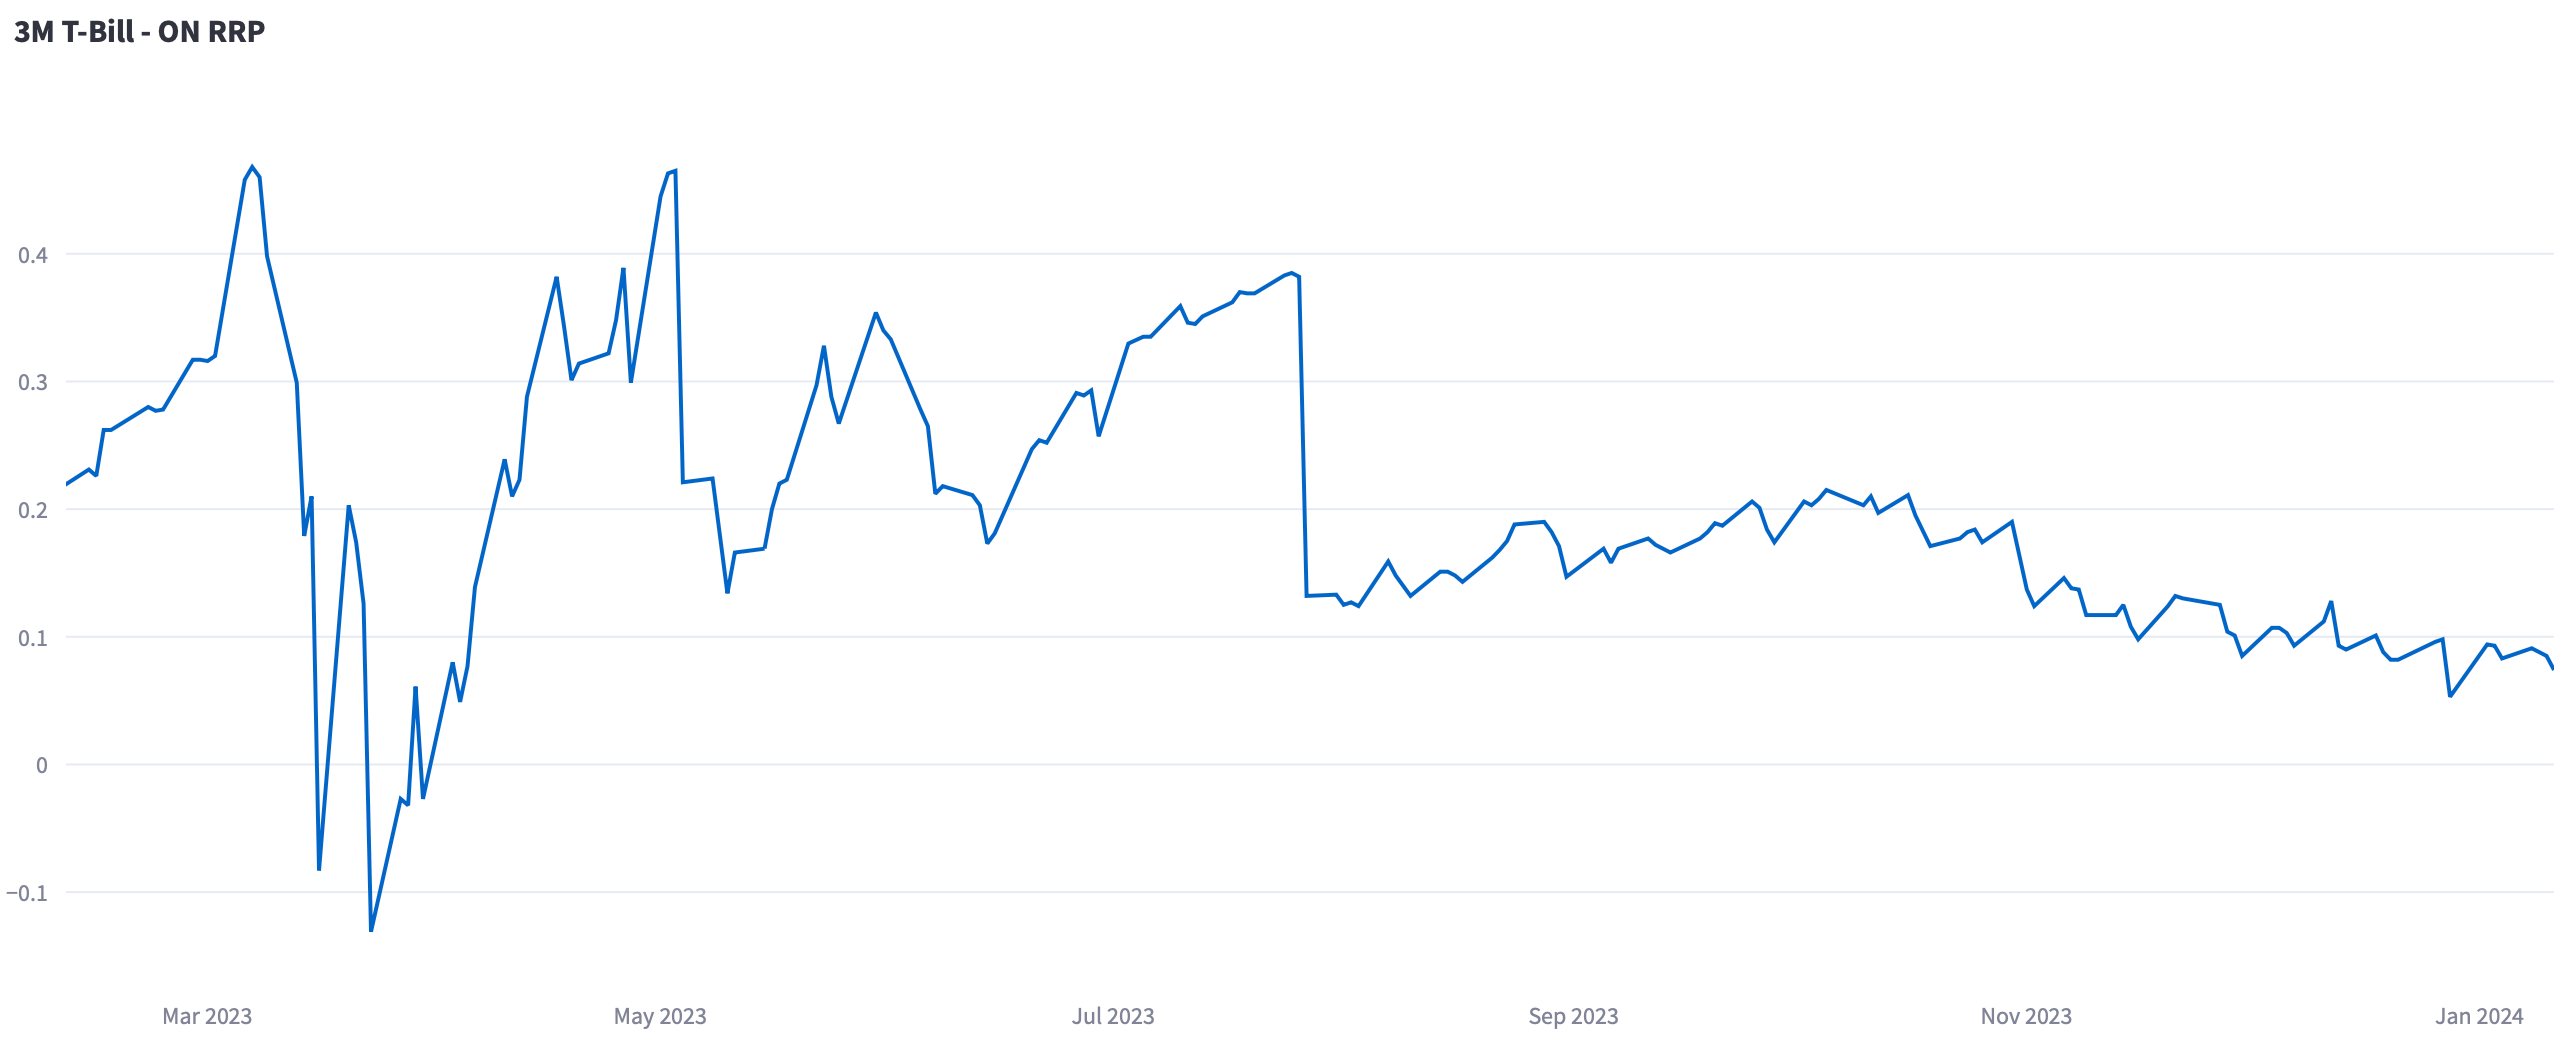
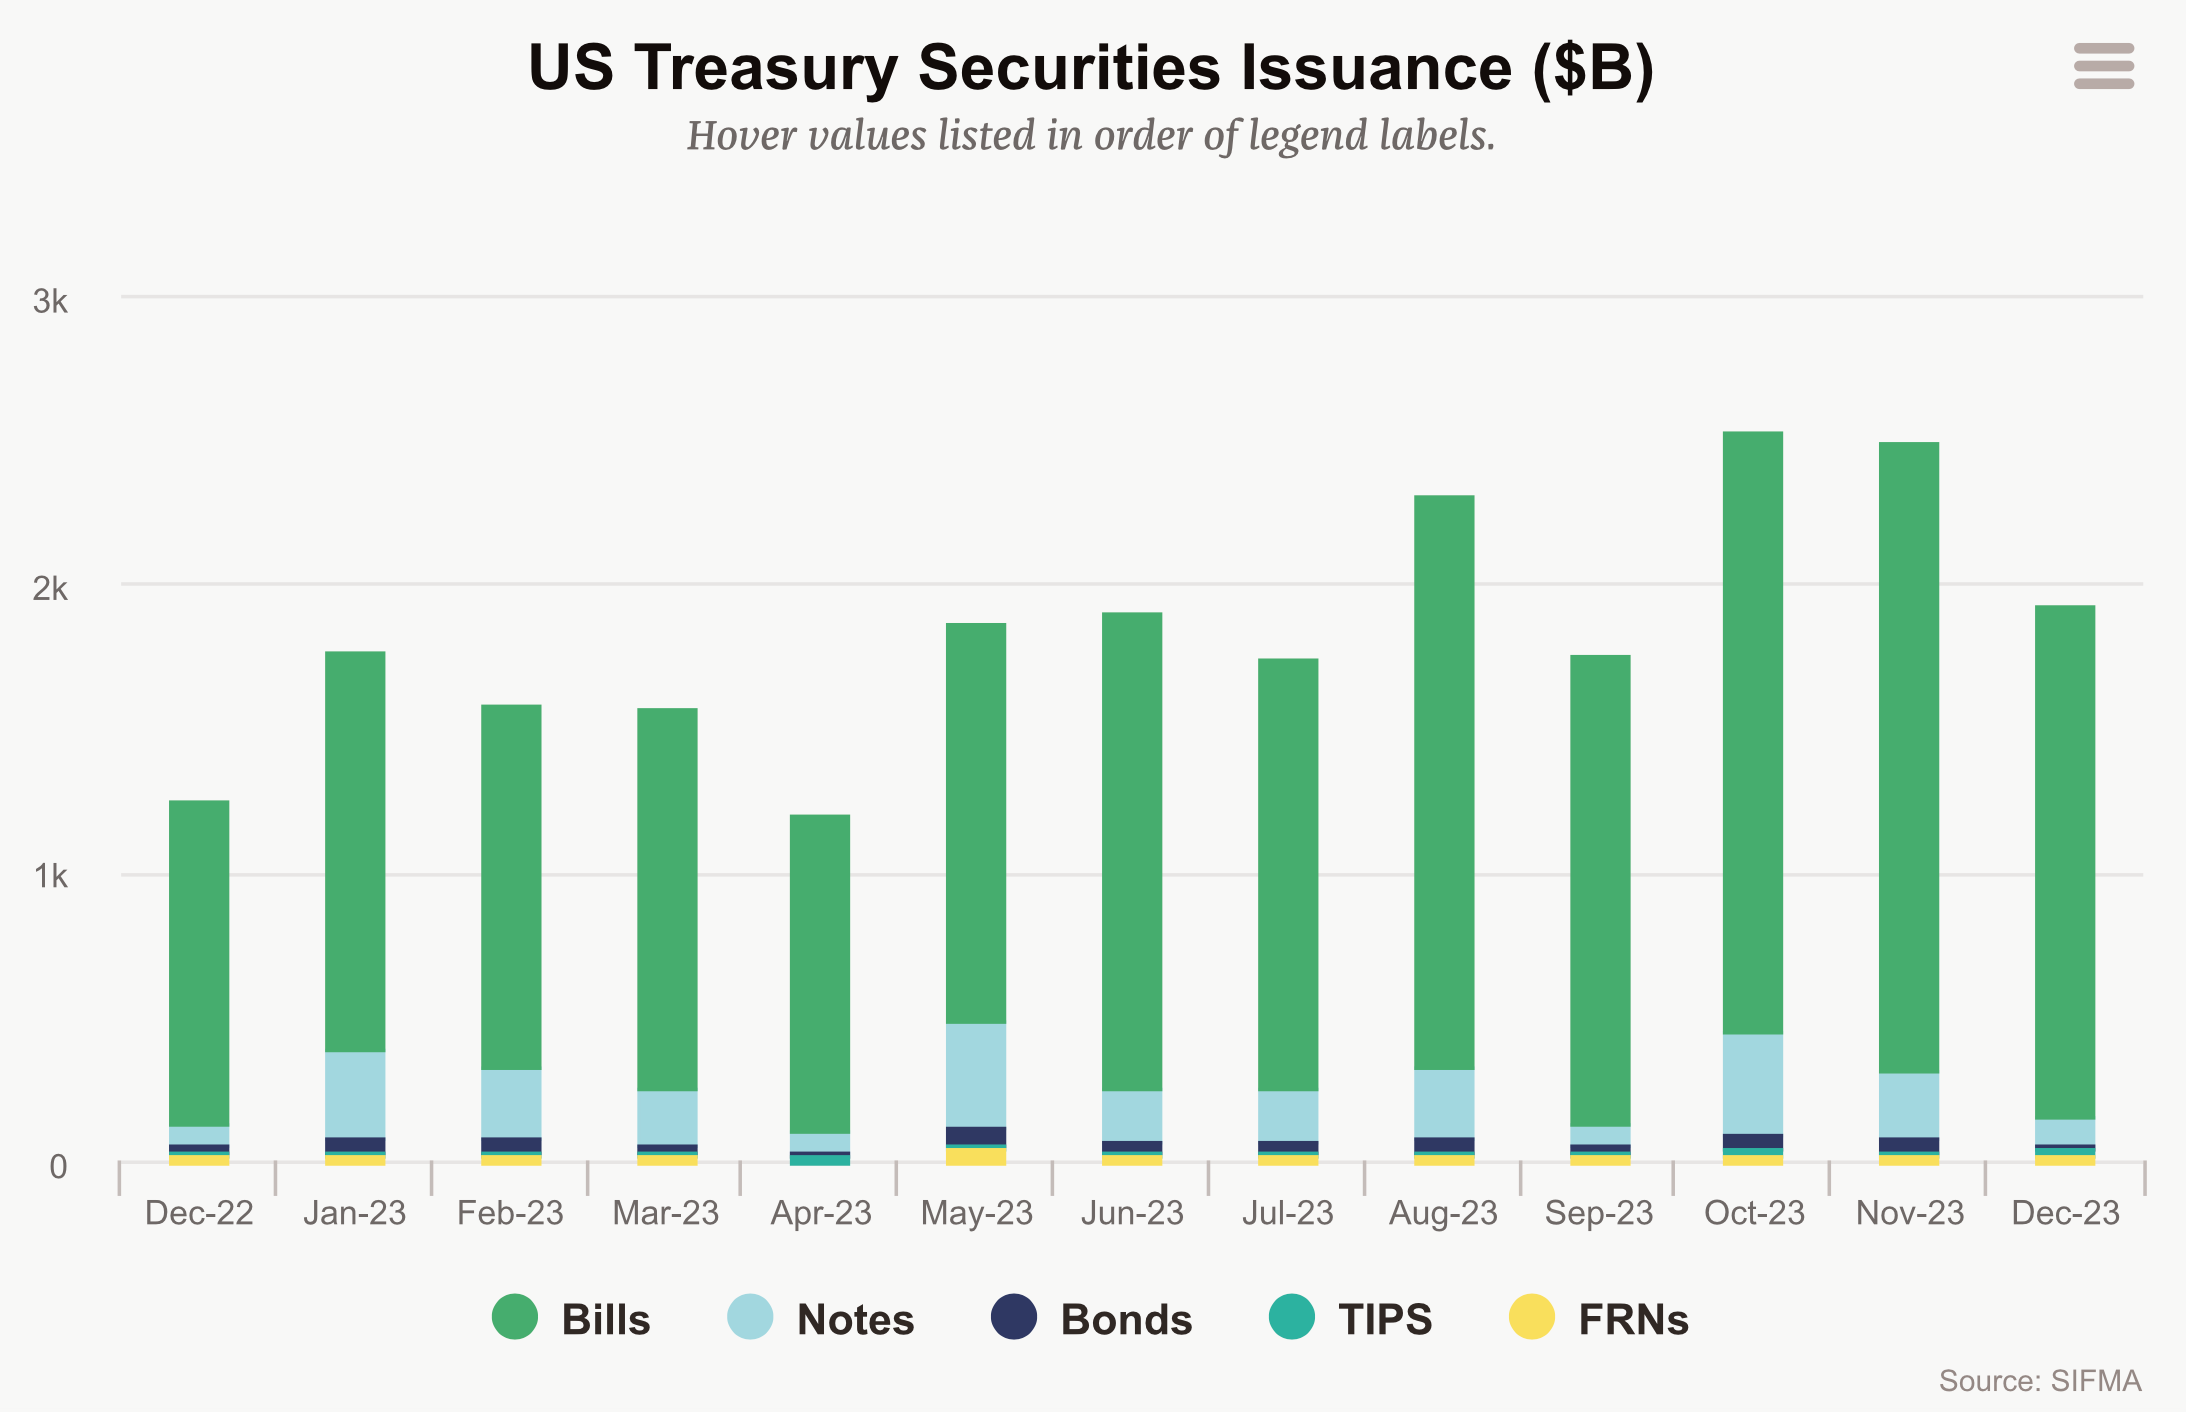
This dynamic also partially explains why the US Treasury was able to issue as many bills in Q4-2023. Money market funds shifted billions of dollars into the bond market, i.e., into T-Bills. This time, the Fed did not have to step in to absorb the issuance from the US Treasury, MMFs, or more broadly speaking the private sector, did.
I expect this trend to continue. With roughly 600bn USD left in the RRP, the 95bn USD a month in QT should be more than offset by the drain of the RRP in the first quarter of 2024. Think about it: When the RRP drops by 150bn USD, thus adding liquidity to financial markets, and QT reduces liquidity by 95bn USD, there is a monthly inflow of 55bn USD. The additional liquidity flowing back into the financial system will keep repo rates (= financing costs) lower despite higher demand for funding. It will be interesting to see what happens when the RRP is fully drained and QT hits financial markets without any offsetting effects, but that will most likely not happen in Q1-2024.
3. Balance sheet capacity in the US: Stressed yet?
The RRP is not the only important driver of liquidity. The repo market, which is the largest, but at the same time least understood, funding market, is another important driver of liquidity. Repo rates reflect whether primary dealers (i.e., large banks) are balance sheet constrained and hinder the flow of money through the financial system.
Balance sheet capacity is a complex topic, but to give you a quick idea: Banks constantly evaluate how many risk-weighted assets (RWAs) they own. Higher-risk assets require more capital to be held as a buffer against potential losses, while lower-risk assets have lower capital requirements. This dynamic is mostly driven by regulation.
Posting more capital against risk-weighted assets is not always of banks interest as it also results in higher costs. If a bank is balance sheet constrained, it would focus on higher-margin trades (which offset balance sheet costs) and try to reduce the balance sheet. That effectively means: Fewer trades are executed and the flow of money through the system is hindered.
How can you monitor balance sheet capacity? I like the GCF Treasury Index (GCF) minus the Triparty General Collateral Rate (TGCR). This spread effectively measures balance sheet capacity in real time.
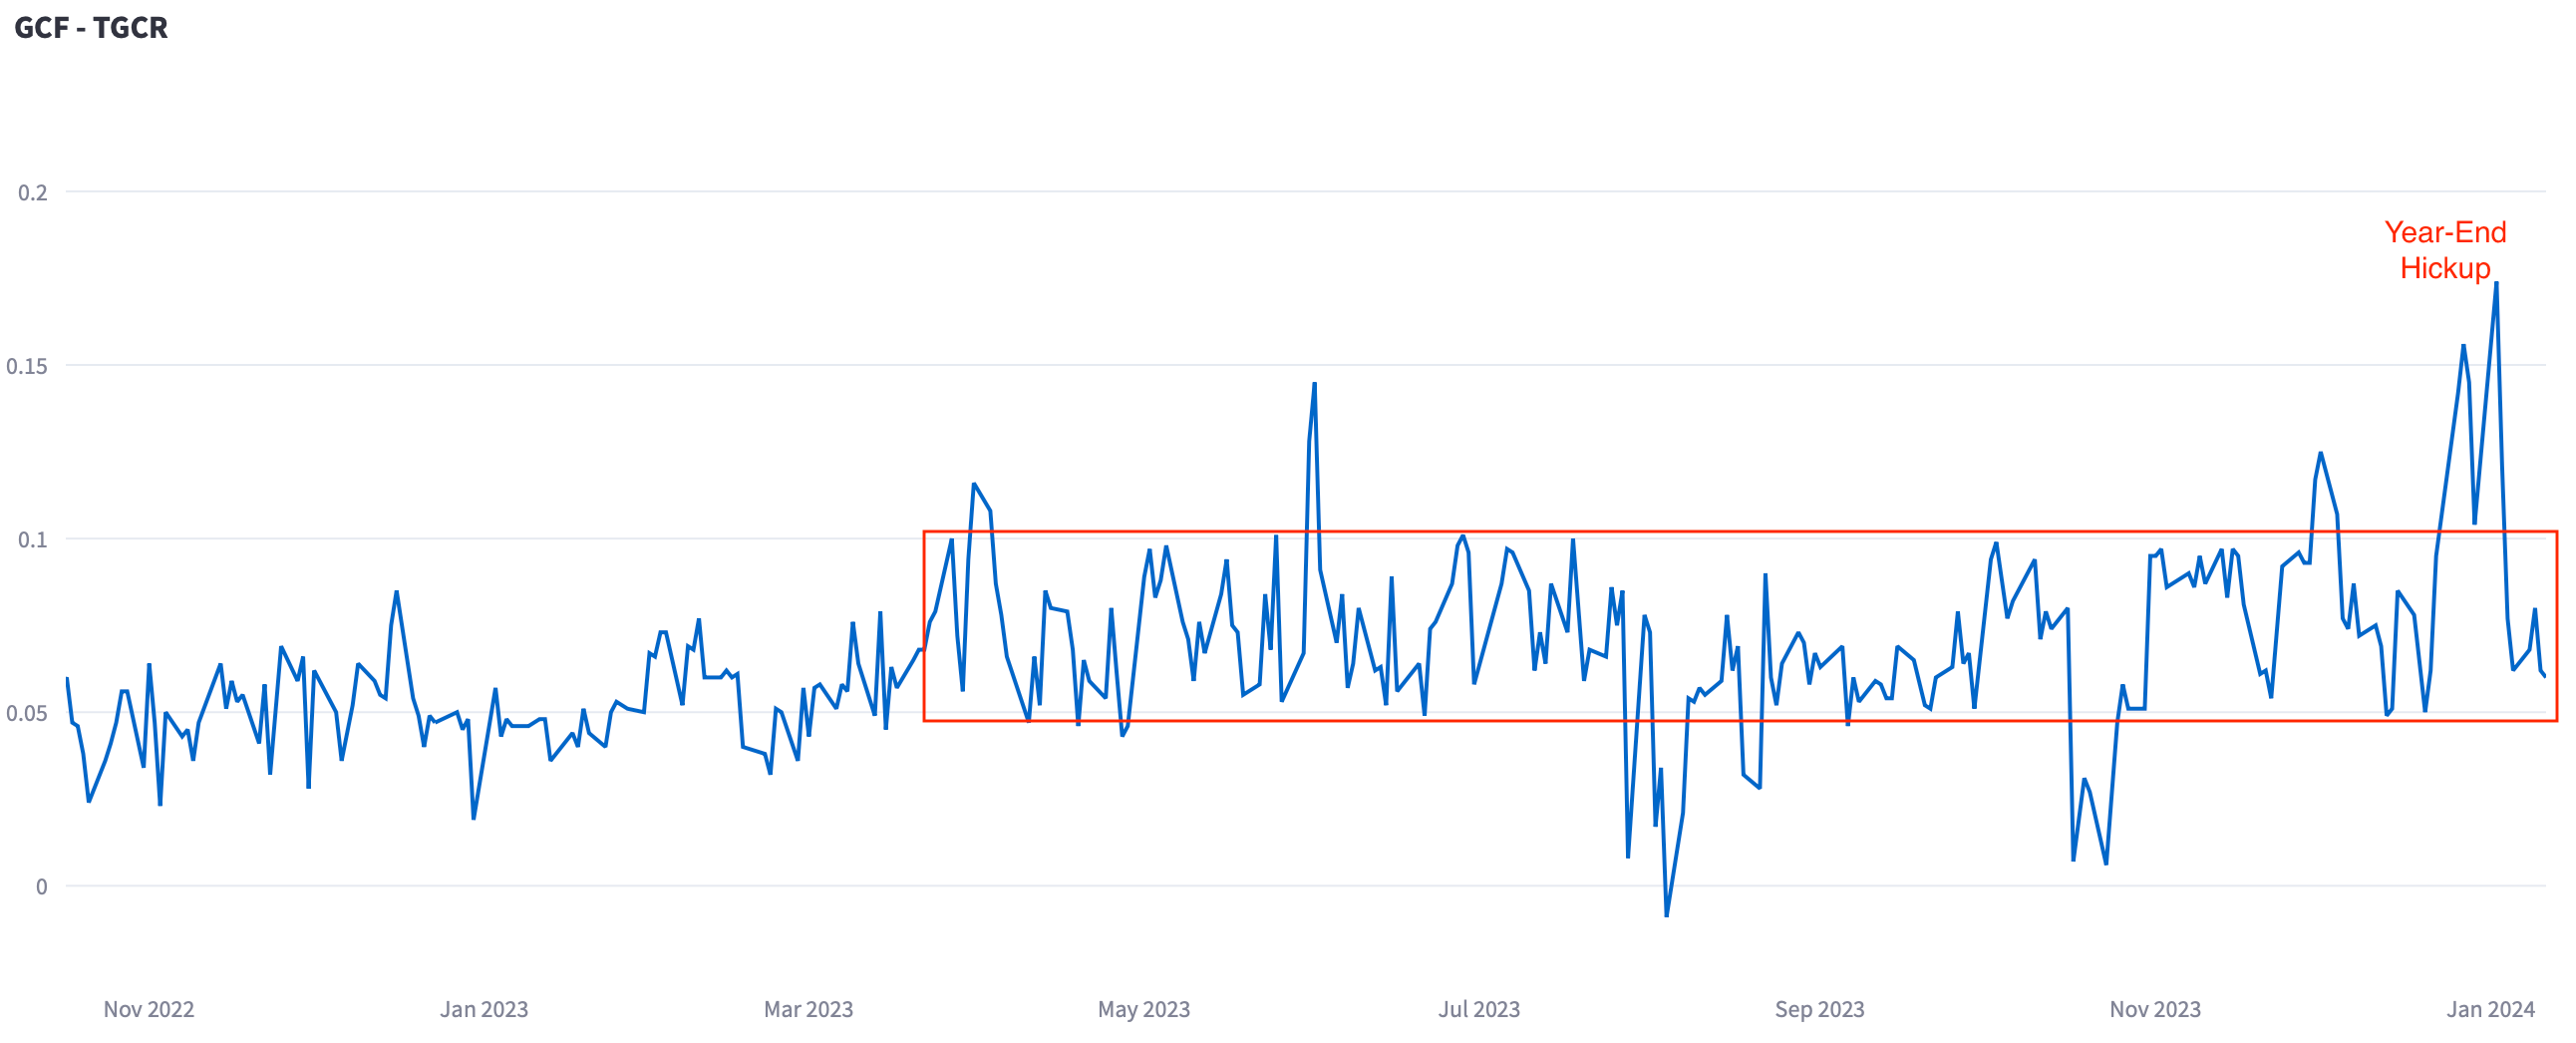
The GCF Treasury rate tracks the average daily interest rate paid in repo transactions with Treasuries as collateral cleared in FICC. Hence, the GCF rate is the best proxy of actual financing costs that the "hot money", i.e. hedge funds, face for US Treasuries in overnight transactions. On the other hand, the TGCR reflects the interest rate cash lenders typically earn in triparty transactions (vs Treasuries).
When banks are balance sheet constrained, they tend to charge more for balance sheet and widen the spread. This dynamic would be reflected in the GCF - TGCR spread. At the moment, except for some regulatory driven year-end hick-up, the spread does not reflect balance sheet constraints. Currently, it stands at 6bps.
4. Funding Stress Incoming?
But what about funding stress in six months from now? Or twelve months from now? Obviously, this also depends on the Federal Reserve and whether QT is going to continue at the current pace. I expect the Federal Reserve to slowdown QT in Q3-2024. I am pretty confident that there is going to be enough liquidity in the financial system in Q1-2024. I am less confident about Q2-2024 if the RRP would be fully drained, but in terms of bank reserves as a percentage of total bank assets or US GDP, Q2-2024 should still be fine.
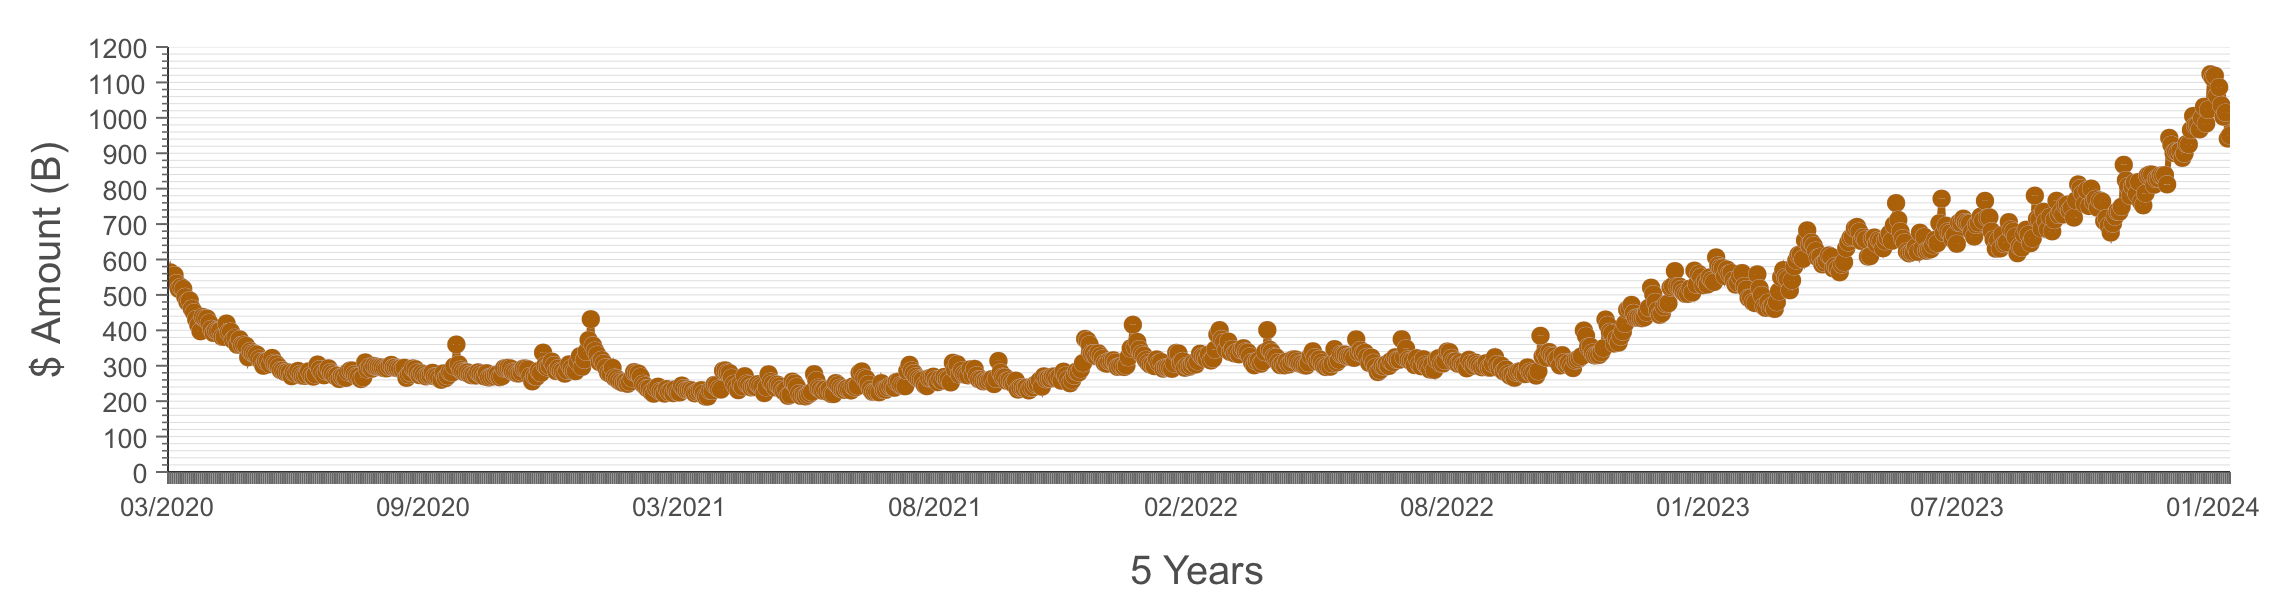
However, one “concerning” trend could be reflected in sponsored repo volumes. All you need to know about sponsored repo is that it is beneficial for primary dealers because they can net trades among different clients, e.g., hedge funds. This is not possible with bilateral repos. A repo transaction of 50mm USD also increases a bank’s balance sheet by 50mm USD. If it would be a sponsored repo transaction, it could be netted with other transactions from other clients. The surge in sponsored repo volumes could indicate that banks are becoming more balance sheet constrained and hence shift to sponsored repos.
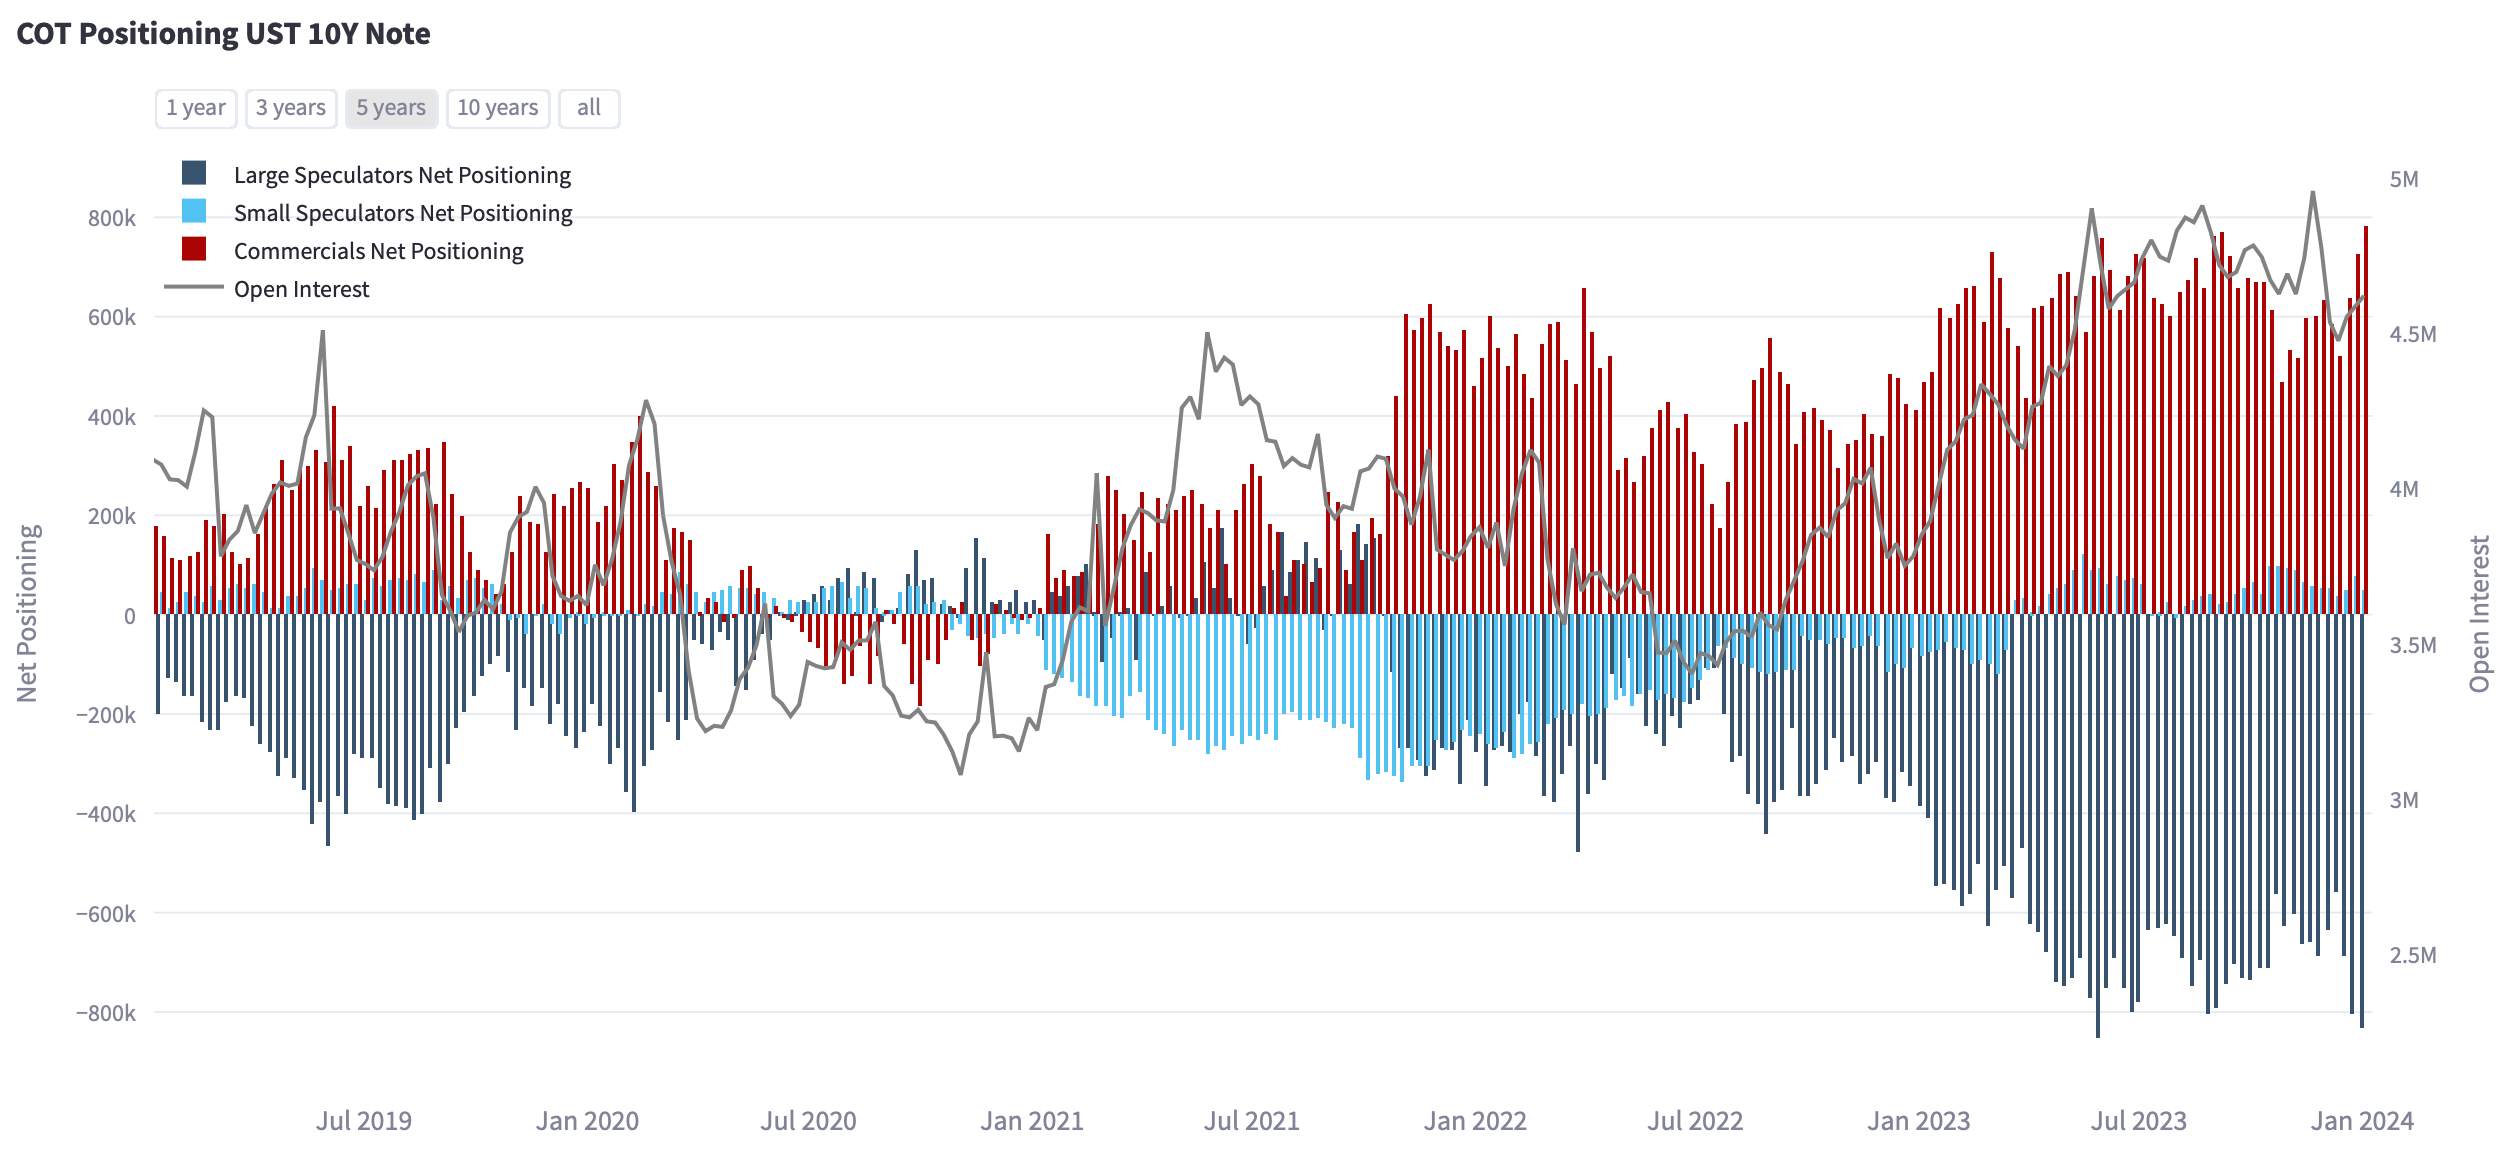
The surge in sponsored repo volumes would also be in line with the large interest in the future bond basis trade (which is an unnetted trade for banks). In the screenshot below you can see the latest COT data. Large speculators (mostly hedge funds) are heavily short 10-year Treasury futures. This does not mean they are bearish. It could be (and likely is) part of an arbitrage trade, in which hedge funds are long the cash bond (CTD) and short the future.
Since the long future bond basis trade only involves one-directional repo interest, primary dealers cannot net the trades. Therefore, primary dealers could benefit from shifting bilateral repo volumes to sponsored repo to be able to net down the one-directional interest from some hedge funds with other clients.
To summarize: The drain of the RRP will provide financials markets with liquidity in Q1-2024. This will likely offset QT of 95bn USD a month and result in a net inflow of liquidity to financial markets. The repo market does not signal any funding stress yet either. The GCF-TGCR spread continues to hover within the range observed over the past year. Balance sheet seems readily available at the moment and should continue to be readily available throughout Q1-2024. However, sponsored repo volumes could indicate that balance sheet might become more constrained later in 2024.
I hope this report was interesting and you could learn something. I am planning on publishing more thoughts and analyses in the future, so feel free to subscribe to my Substack and Twitter. It is all for free! I will also talk about other market-related topics and publish the predictions of some of my financial models!
great take, cheers!