


From SOFR Pricing to Equities: Slowing Growth, Fed Hawkishness, and Short US Dollar Positioning
This week’s article covers SOFR curve pricing, the latest FOMC dot plot updates, new economic data releases, and the macro trades to watch next.

Hi everyone,
This article is structured in five key sections:
Chart of the Week
Macro Pulse: What is happening in the economy?
Risk Assets Rundown: Market views and trade ideas
Positioning Update
Closing Thoughts / Outlook
These write-ups take a lot of time and effort to put together, so if you find them helpful, I’d really appreciate it if you shared them, forwarded them to a friend, or posted them on X. It keeps me motivated to keep doing the work and putting these pieces out regularly. With that said, let’s dive right in!
1. Chart of the Week: SOFR Pricing After the FOMC
This week’s Chart of the Week belongs to the SOFR curve, which offers a concise snapshot of market expectations following the latest FOMC meeting. Here's how we can break it down:
Rectangle: The very front-end of the curve - up to June 2026 - remains virtually unchanged from a week ago. It continues to price in more rate cuts than the FOMC communicated, suggesting the market isn’t fully buying into the Fed’s forward guidance.
Rectangle: Powell’s term as Fed Chair ends on May 15, 2026. Interestingly, the SOFR curve reflects a notable increase in the pace of rate cuts post-Powell, relative to both recent market pricing and the Fed’s own Summary of Economic Projections (SEP).
Rectangle: Beyond June 2028, the curve continues to imply a higher terminal rate - approximately 3.6% - compared to the SEP’s estimate of 3.0%.
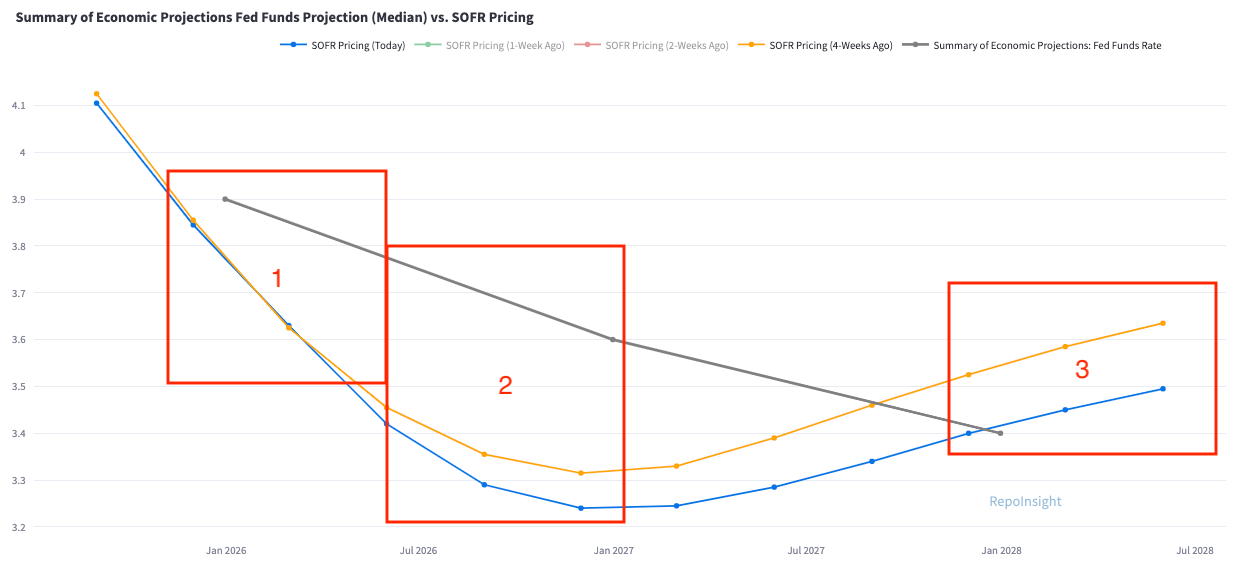
A useful proxy for terminal rate expectations is the December 2028 SOFR future, which currently trades at 3.59%. If you expect a material slowdown in the economy, this might be the part of the curve you want to be long as it remains elevated relative to the Federal Reserve’s communication.
2. Macro Pulse: Four Macro Trends Pointing to Slower Growth
Several macroeconomic dynamics are beginning to unfold that suggest the U.S. economy may be heading into a slower growth phase.
Trend: Income growth is losing momentum - a warning sign for future consumption.
In recent quarters, robust income growth combined with a historically low savings rate helped fuel strong consumer spending. The savings rate stayed low in part because average wage growth remained elevated and asset prices were high - households, in aggregate, felt wealthier and spent accordingly. But wage growth has started to decelerate, as the chart below illustrates.

This slowdown in income - particularly if accompanied by stagnant or falling asset prices - poses a risk to consumption growth. Since consumer spending makes up roughly 70% of U.S. GDP, even a mild deceleration could have a meaningful impact on overall economic growth. For context, the S&P 500 is flat since October 2024, while long-duration bonds (e.g., TLT) are flat since October 2023.
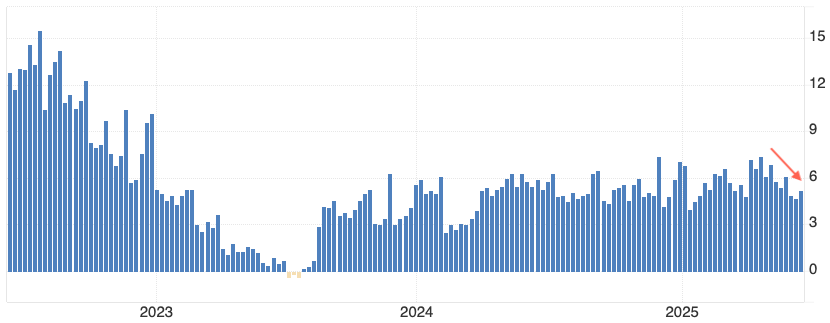
We’re beginning to see early signs of slowing consumption in the U.S. economy. One example is the Redbook Index, which tracks same-store sales growth across a representative sample of major retailers. In recent weeks, retail sales momentum has weakened - a potential signal that household spending is starting to cool.
Looking beyond retail, a broader set of high-frequency economic indicators is also flashing first signs of slowing. The Weekly Economic Index (WEI) - which aggregates initial jobless claims, payroll tax withholdings, electricity demand, rail traffic, wholesale fuel sales, and more - is showing a softening trend. This kind of composite signal suggests the deceleration is not isolated to just one segment of the economy.

Trend: The Labor Market Is Losing Momentum
Following the pandemic, the U.S. labor market was historically tight. It was easy to switch jobs, and companies struggled to attract and retain workers. That dynamic was largely driven by a persistent imbalance: job openings consistently exceeded the number of unemployed workers. But that trend has reversed - for the first time in years, the number of unemployed Americans now exceeds available job openings.

Source: X
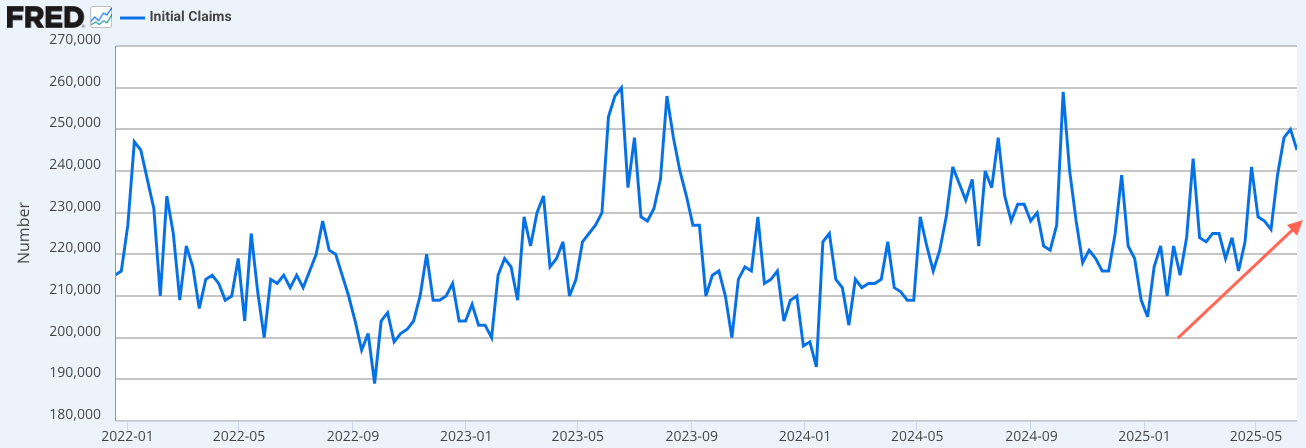
Initial jobless claims have also been trending higher in recent weeks - another signal of a cooling labor market. This slowdown could be exacerbated by AI adoption: as firms boost productivity through automation, they become less inclined to hire. This is particularly relevant for small businesses, which collectively employ the majority of the U.S. workforce.
Trend: The Housing Market Remains a Source of Risk
The housing market continues to face pressure from elevated interest rates. If this stagnation persists, homebuilders may be forced to reduce headcount as construction backlogs shrink. This week’s data showed that both building permits and housing starts came in below expectations. That said, housing starts still point toward a slight acceleration in single-family units under construction.

Many economists have been too bearish on housing in recent months. While single-family units under construction have indeed declined, residential construction employment has continued to rise. At some point, this divergence may prove unsustainable.

When comparing residential construction employment to broader nonfarm payrolls, it becomes clear that housing is one of the most cyclical components of the labor market. If homebuilders begin layoffs, it could spill over into overall employment and weigh on household spending.

Trend: Hard Data Is Now Surprising to the Downside
In the post-COVID era, many investors were misled by weakening soft data - such as falling consumer confidence or contractionary PMIs - while hard data remained resilient. For months, actual economic activity held up much better than surveys implied. But that dynamic may be shifting. In recent weeks, hard data has started to come in below expectations. This is a notable change and could mark the beginning of a broader slowdown.

Source: X
3. Risk Assets Rundown: How the FOMC Impacted Bond Market Pricing
This week’s two major events were: 1) the FOMC meeting and 2) U.S. airstrikes on Iranian nuclear facilities. While geopolitical tensions are always a risk to markets, the true impact on financial assets will depend on how Iran responds and whether oil prices experience a sustained spike - potentially triggering global inflationary pressures. Given the unpredictability of Iran’s reaction, I’ll focus this section on the FOMC and how bond markets are repricing.
I broke down the key FOMC takeaways in a detailed thread on X. If you’re not already following me there, you can find more timely insights in real time:

Here’s what the Federal Reserve’s updated Summary of Economic Projections now shows:
Slower GDP growth in 2025 (1.4%) and 2026 (1.6%)
A slightly higher unemployment rate in both years
Higher core PCE inflation: 3.1% in 2025 and 2.4% in 2026
Interestingly, while the 2025 Fed funds projection remains unchanged at 3.9%, the median path for 2026 and 2027 has moved higher - now at 3.6% and 3.4%, respectively.

This puts markets in an unusual situation: macro data is weakening, yet the Fed is removing rate cuts from the longer-term outlook. For 2025, seven FOMC members now see no cuts at all - up from four in the previous dot plot. Powell also made it clear that the Fed will not "look through" tariff-driven inflation. That reduces the likelihood of a dovish pivot in the near term. All in all, the June FOMC was hawkish relative to the economic momentum and expectations.
As outlined in the Chart of the Week section, the SOFR curve tells a different story. It’s pricing in significantly more easing once Powell’s term ends on May 15, 2026. Moreover, the terminal rate implied by December 2028 SOFR futures sits around 3.6% - well above the Fed’s long-run estimate of 3.0%. If the economic slowdown intensifies, those December 2028 contracts could offer upside as a hedge against a disinflationary recession.

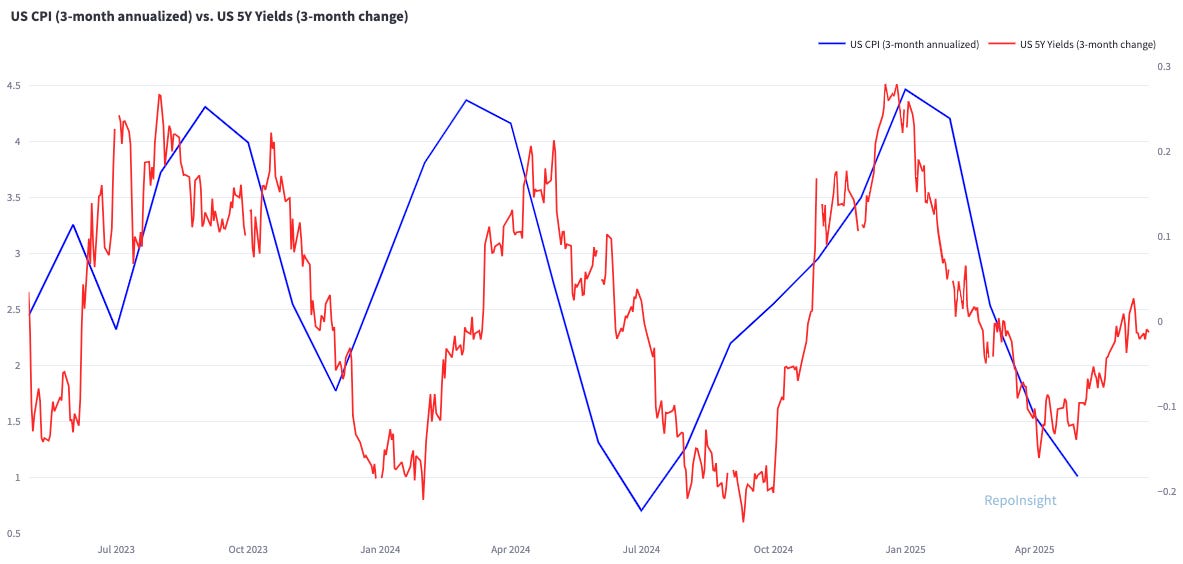
On the flip side, if tariffs and geopolitical escalation - particularly in the Middle East - push inflation higher, we should expect a renewed upward move in 5-year yields. Bond markets have already started to price in this risk. The chart below shows the 3-month change in U.S. CPI alongside the 3-month change in 5-year Treasury yields - a relationship worth tracking closely.
If the Federal Reserve begins to cut rates, it could ironically push long-end yields higher. Why? Because easing policy could lift both long-term growth and inflation expectations. On top of that, tariff-driven inflation adds another upside risk to the back end of the curve. And then there’s the elephant in the room: fiscal policy. Rising deficits and debt issuance have made bond buyers far more price sensitive. All these forces still suggest curve steepening as the dominating macro narrative.
Let’s pivot to the U.S. dollar. Over the past few months, I’ve repeatedly made the case for Japanese Yen weakness against the dollar. My core thesis was that the market had become overly crowded with long-JPY positions, driven by a narrative that rising inflation would eventually force the BOJ to hike rates. However, that near-term bullish view on JPY clashed with the long-term structural bear case: the BOJ’s excessive money printing and debt levels exceeding 240% of GDP. That macro contradiction is now playing out, with the yen weakening notably.

For more detail, I outlined my full view in the following X thread - arguing that in highly indebted economies with aggressive monetary easing, the currency becomes the natural release valve.

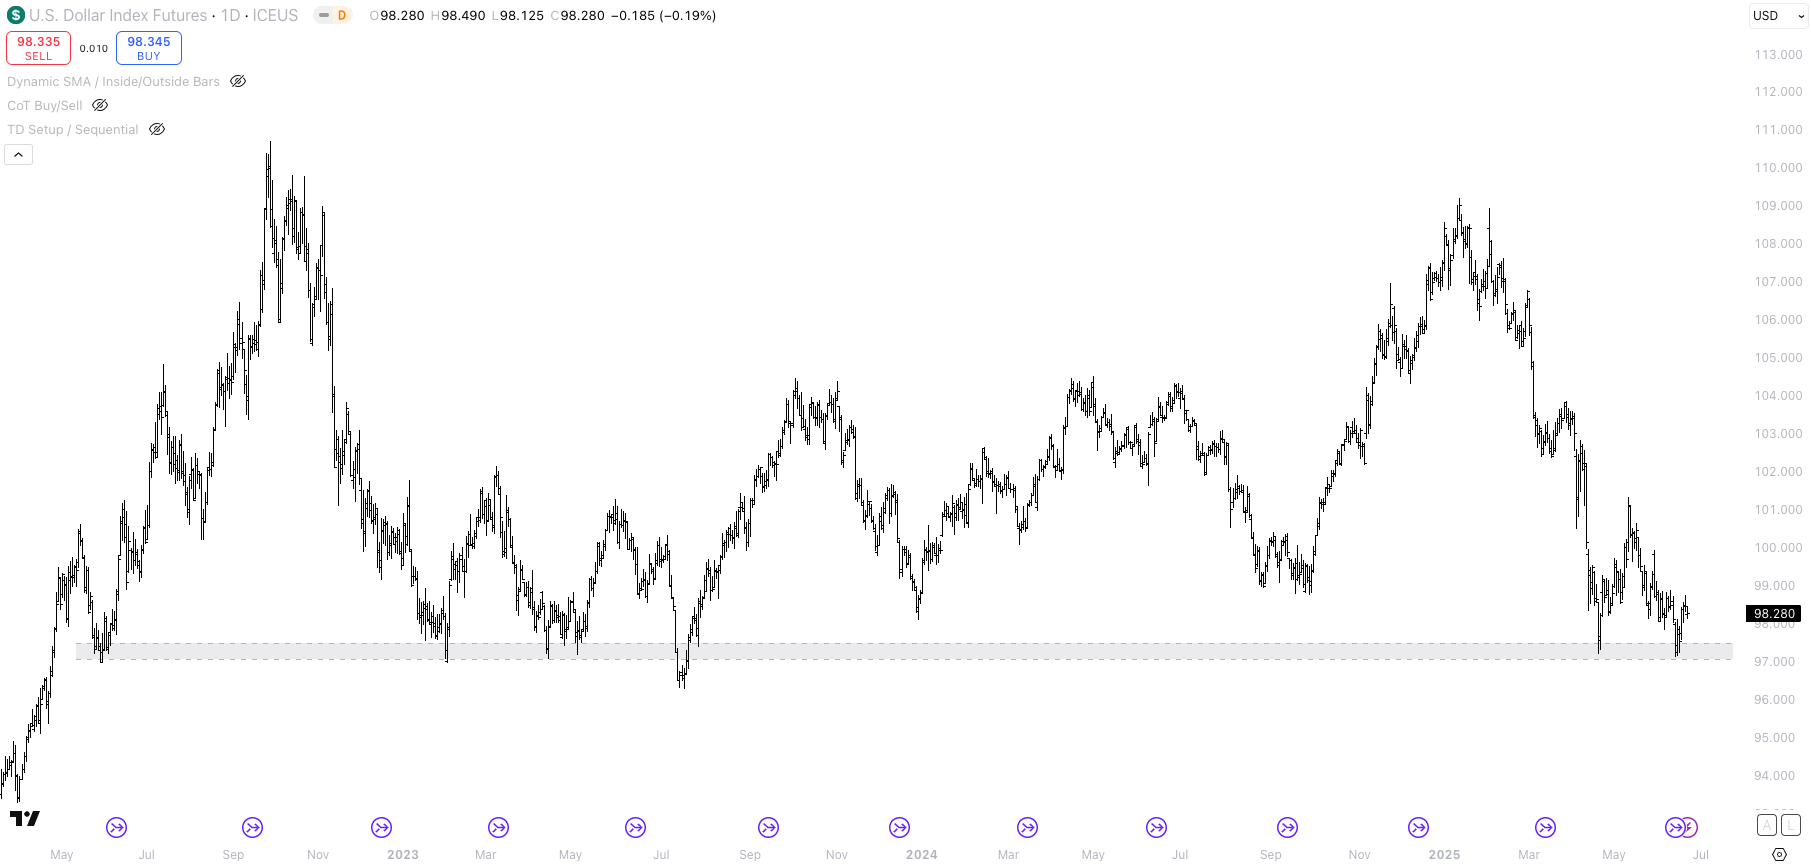
The EUR, GBP, and CHF have remained relatively strong versus the U.S. dollar. That said, I believe the Euro and Swiss Franc are now looking increasingly vulnerable. USD shorts are paying over 200bps in negative carry versus Euro rates. At the same time, the recent spike in oil prices is a clear headwind for net energy importers like the Eurozone. Adding to that, Euro positioning has become much longer. Technically, the euro is approaching long-term resistance on the daily chart.

Zooming in, the 4-hour chart shows the euro testing an upward trend line. A clean break below this level could indicate that bullish momentum is fading.

Let’s turn to equities. The S&P 500 has remained resilient despite the Iran-Israel conflict. Meanwhile, Israel’s TA-125 index has rallied to new highs, reflecting market optimism about a potential long-term peace settlement and possibly a more Israel-friendly regime emerging in Iran.

The U.S. stock market should remain largely insulated from the conflict since it does not directly affect U.S. corporate earnings. Despite signs of weakening macro momentum, I remain long equities. For a meaningful downturn, we would need a sustained series of growth-negative news. In the absence of that, equities tend to drift higher over time as earnings grow.
And earnings expectations - as highlighted in last week’s report - have risen to new highs. For me, that is reason enough to remain long equities, but with “one foot out of the door”. I think the backdrop of weakening hard data, high valuations and the Federal Reserve on hold could mean that it will be time to take off equity exposure at some point in the second half of the year.
It’s also worth highlighting that many investors who missed the rally from recent lows have now jumped back in. The NAAIM Exposure Index rose to 94 this week. Historically, readings above 95 have often preceded pullbacks. When positioning becomes too crowded and there are few buyers left, a 3-5% correction becomes more likely.

Lastly, I want to touch on gold. I’m considering increasing my allocation again in my long-term investment account. Gold remains a strong portfolio diversifier, and central banks continue to accumulate it. According to the World Gold Council’s Central Bank Gold Reserves Survey 2025, published June 17th, 43% of central banks (31 out of 72 respondents) expect to increase their gold reserves over the next year. This is up significantly from last year’s 29% (20 out of 69).

4. Trade Tracker / Portfolio Update
Unfortunately, I am restricted in what I can trade. If that would not be the case, I would have been short JPY futures for a while. Or I would have looked at shorting CHF futures on Tuesday. Instead, I converted most of my Euro cash into US dollars in my EUR-denominated trading account on Tuesday. It is not ideal as I would much rather trade long US dollars versus other currencies - the Euro has been the strongest currency recently.
Alternatively, I am thinking about converting back the US dollars into Euros, but buying US dollar index futures. The US dollar index is 57.6% Euros, 13.6% JPY, 11.9% GBP, 9.1% Canadian dollar, 4.2% Swedish krona and 3.6% Swiss Franc. That way, I could trade the view versus a basket of currencies. Still far from ideal, but possibly better than converting Euros into US dollars.
My two main trade ideas are still long US dollars (short JPY, short CHF) and long equities. In fixed income, I think long SOFR December 2028 as a hedge against a deflationary recession looks attractive as the terminal rate pricing remains elevated relative to the Federal Reserve’s communication. The trading account is up 6.36% year-to-date - I am waiting for the next great risk-to-reward trade.
5. Closing Thoughts / Outlook
Next week promises a busy calendar, featuring quite a few economic releases alongside numerous Fed speakers, most likely new Iran-Israel headlines, and potential updates on tariffs.
Monday: European PMIs, UK PMIs, US PMIs, Fed’s Waller and other officials speak
Tuesday: Fed Chair Powell testifies, US Consumer Confidence, German Ifo Business Climate, Canadian inflation data
Wednesday: Fed Chair Powell continues testimony, Australian inflation figures, New Home Sales
Thursday: BOE’s Bailey speaks, Initial Jobless Claims, Durable Goods Orders
Friday: Canadian GDP, US Core PCE inflation, Tokyo Core CPI
Looking ahead, two key dates to watch are July 4th — the deadline for the “Big Beautiful Bill” in the House — and July 9th, when the current tariff pause expires.
I hope you enjoyed this article. This is not investment advise and all views are my own. I write these articles because they help me to stay disciplined and transform my thoughts into actionable trade ideas. I always appreciate your feedback, likes and comments!
Dear Mr. Repo,
Thank you once again for a great write-up. This was really a deep look into various global markets, I truly enjoyed it.
Regarding your view about the steepening of the curve (2s10s I'm assuming?) in the U.S., I have the same view, but I'm having some hard time thinking about expressions, because I'm not sure if the steepening will be a bullish, a bearish or a combinated one.
The 2s could come lower as the market starts digesting the weakness in hard data you reference in your post, but at the same time, you clearly show that futures traders in SOFR al already pricing in more cuts than the 2 that the Fed showed in the dot plot.
(I have a question here regarding how to assess what's priced in. If I look at CME fed watch tool-which I've heard is not perfect at all- I see december 25 probabilities clearly sitting in two cuts, much like the Fed stated. So what would you trust more, CMEs tool or SOFR futures?)
Political risk could also get more priced in, as you point out, if the market gets convinced that Trump will apoint an "ultra" dovish chair.
At the same time, 10s could drive a bear steepening as inflation is repriced higher and, if you'll allow, as credit creation + deficits keep pointing to a nominal GDP that remains resilient.
My doubt comes from the following: if the 2s reprice lower (lower rates) given economic concerns, then real rates in the long end will come down as well, so a long 2s short 10s could backfire, I think.
Would love your thoughts here.
THank you once again!
Truly appreciate your pieces.
BEst,
Valentino